
Campus Sustainability Map
Project Description
Technology has been changing the world at a rapid pace for decades. Computer science holds tremendous promise for improving the human condition and facilitating the progress of communities and the advancement of societies.
The course Computing for Good at Georgia Tech brings together seasoned and emerging computer scientists to work together on projects from broad areas across health, sustainability, disaster relief, disability assistance, homelessness, and education.
The objective of this project was to create an on-line, dynamic tool to visualize Georgia Tech’s sustainability ecosystem and allow people who are interested in sustainability on campus to find and connect with each other easily.
The client was Georgia Tech's Office of Campus Sustainability, Associate Director, Anne Rogers, and our team consisted of three computer science Master degree students and myself. We were supervised by Prof. Ellen Zegura and Prof. Beki Grinter and I was responsible for leading the team, designing the tool, and managing the project overall.
Process
User Research & Requirements Gathering
During our interview with Anne Rogers, she informed us that while there are many sustainability-related activities on campus, these efforts are not coordinated and often lack visibility. Therefore, she sought to develop a digital, interactive map to visualize and communicate the inter-relationships across departments, people and campus initiatives within the operational, academic, and student landscape of the campus. In addition, she requested that we prepare an easily updatable inventory of relevant campus initiatives.
After gathering the requirements from Anne, we conducted interviews with seven potential users of the system that included staff and students engaged in on campus sustainability projects of different departments at Georgia Tech.
By intersecting client requirements and user needs, we defined three key product requirements:
Directory - allows people to find and connect with each other.
Interactive map - provides a visual overview of all current sustainability initiatives at Georgia Tech.
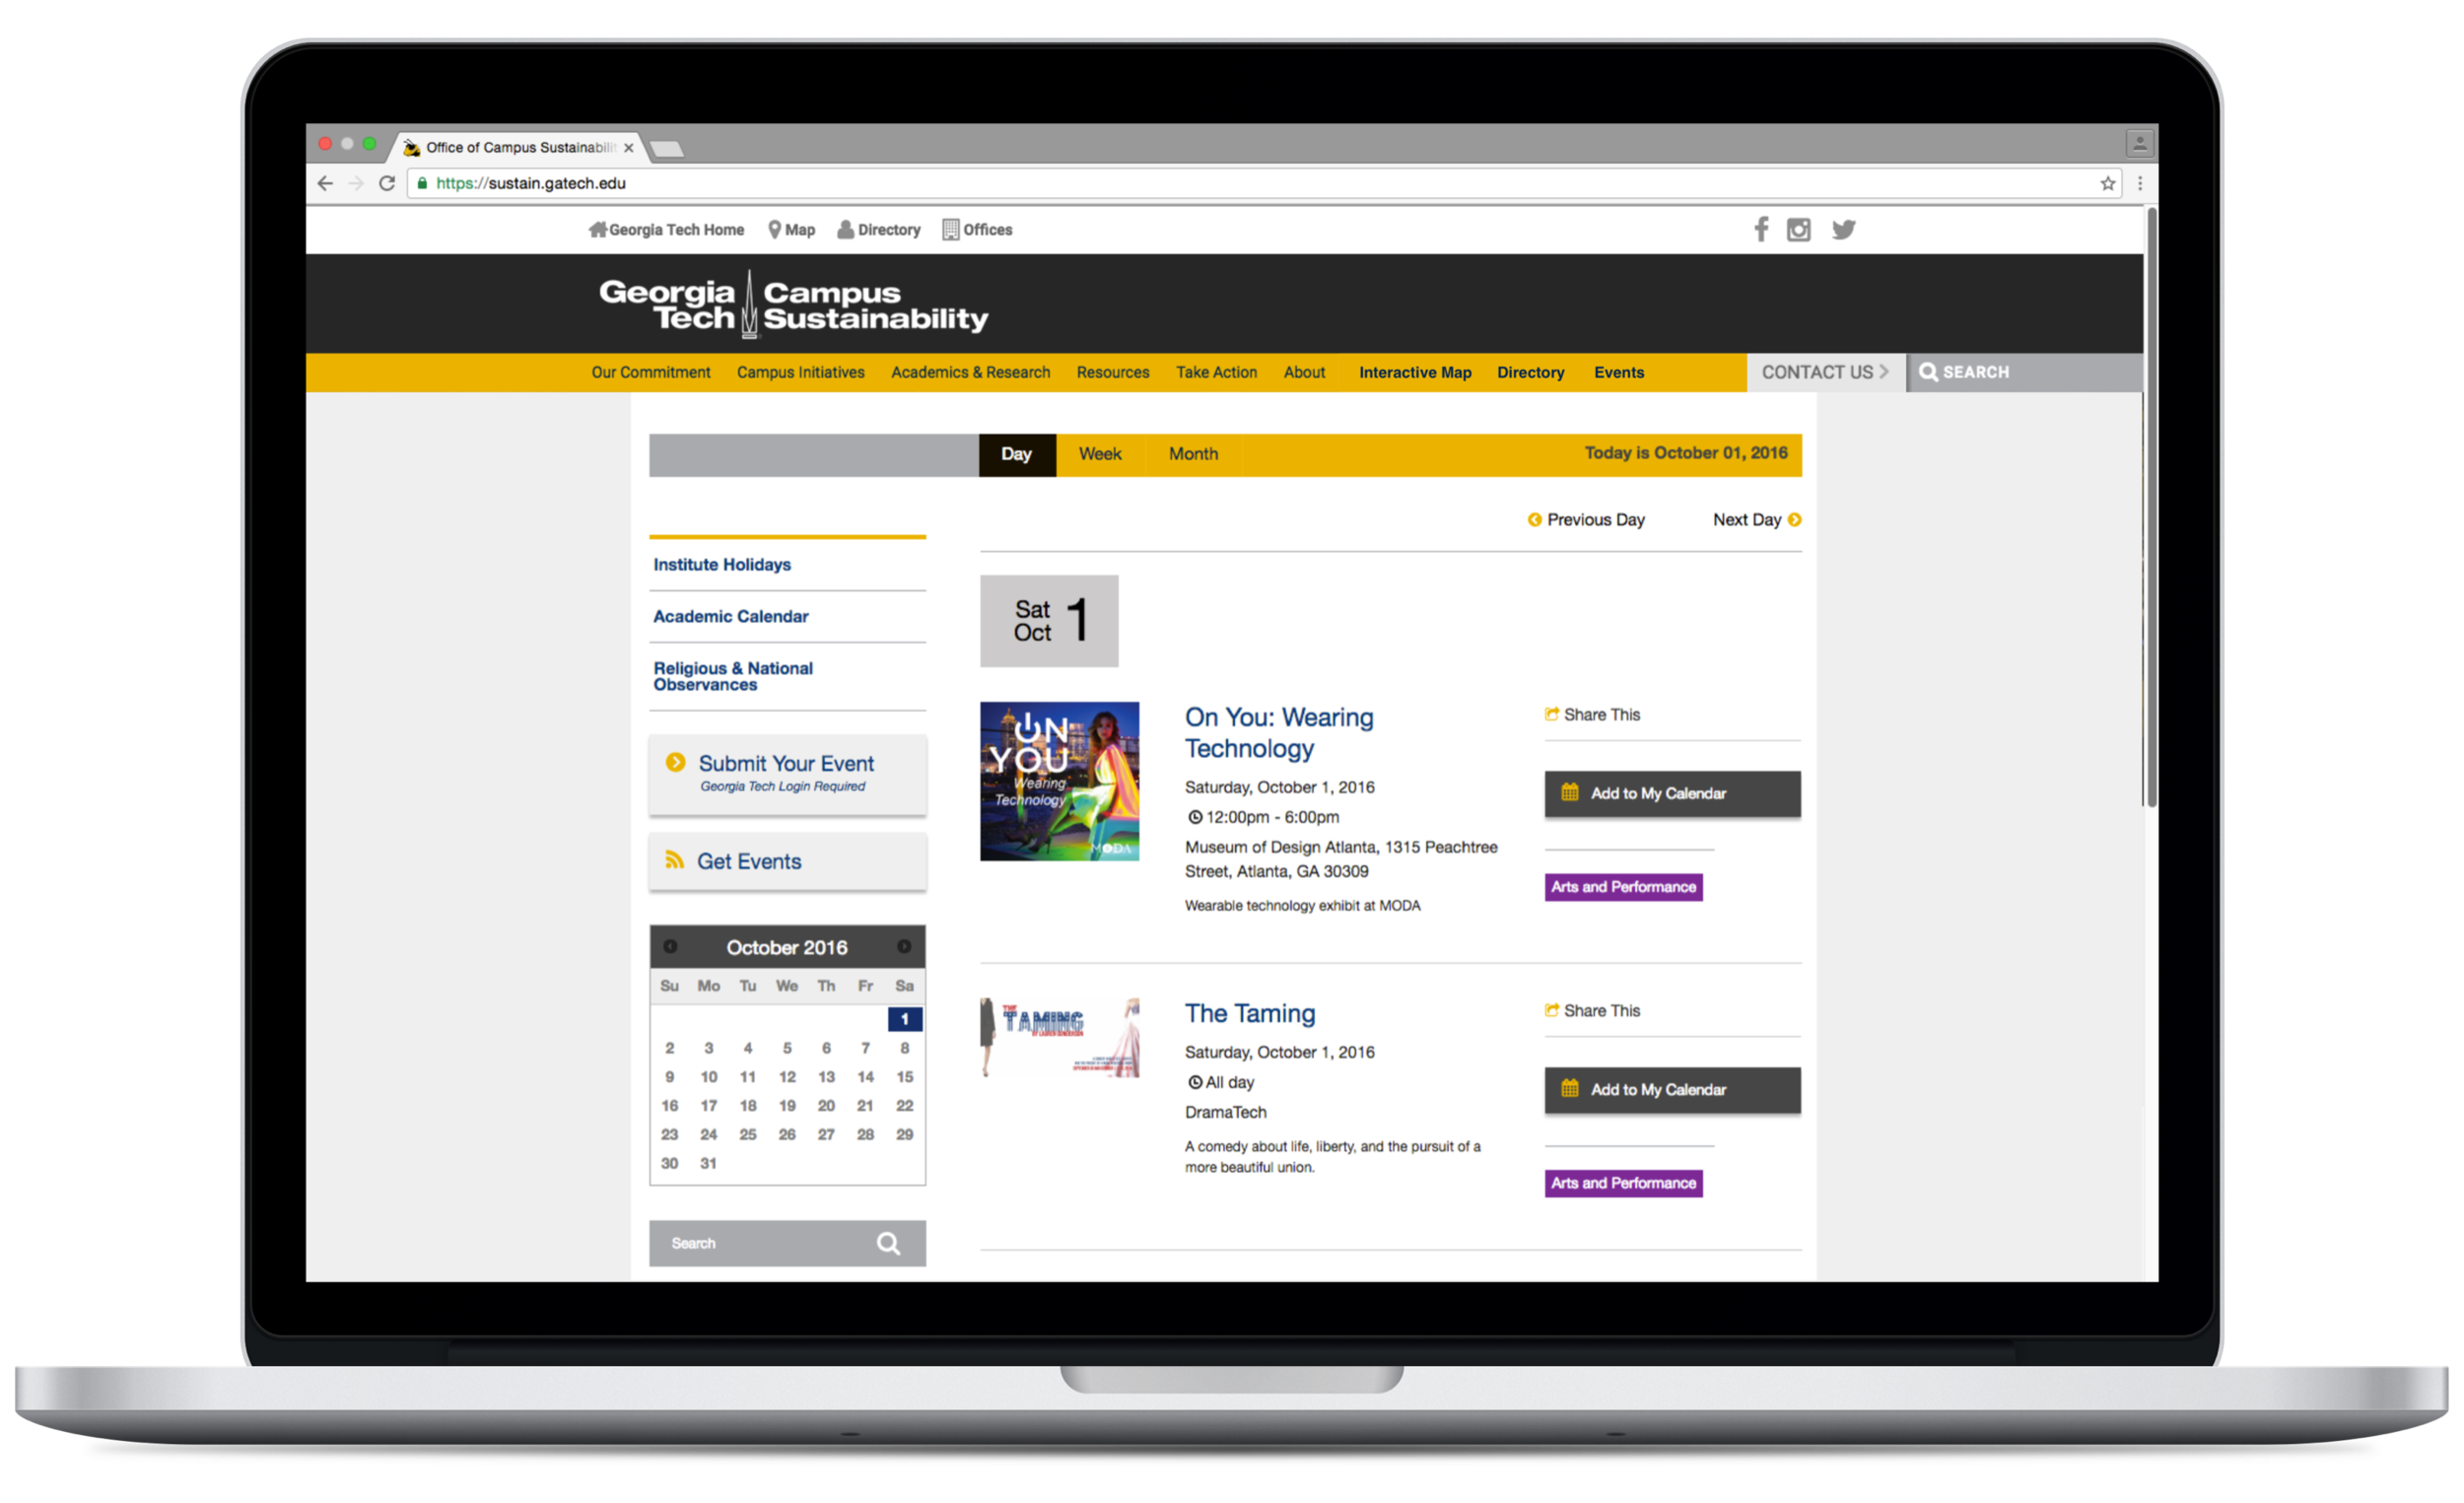
Platform for events posting - increases awareness of sustainability-related activities on campus.
Competitive Analysis
To understand our challenges and their possible solutions, we analyzed related products. Two of the most relevant systems were Emory’s Sustainability Ecosystem Map and Georgia Tech’s Aerospace Design Lab visualizations.
The main conclusions from our analysis were:
Keep it simple and don’t overwhelm the user with data - while the visualization, which was created at Emory, was comprehensive and showed all the interrelationships across the campus, it had too much information and overwhelmed users.
Don’t just visualize, but also provide insights - visualizing data alone isn’t sufficient. A good visualization should provide the users with insights from the data and help them infer important conclusions based on the visualization.
Ideation
To find creative and practical solutions, we had multiple collaborative discussions and ideation sessions. In some cases, in order to refine our understanding of the requirements, we conducted participatory design meetings with Anne Rogers.
Medium Fidelity Prototype and SW Architecture Design
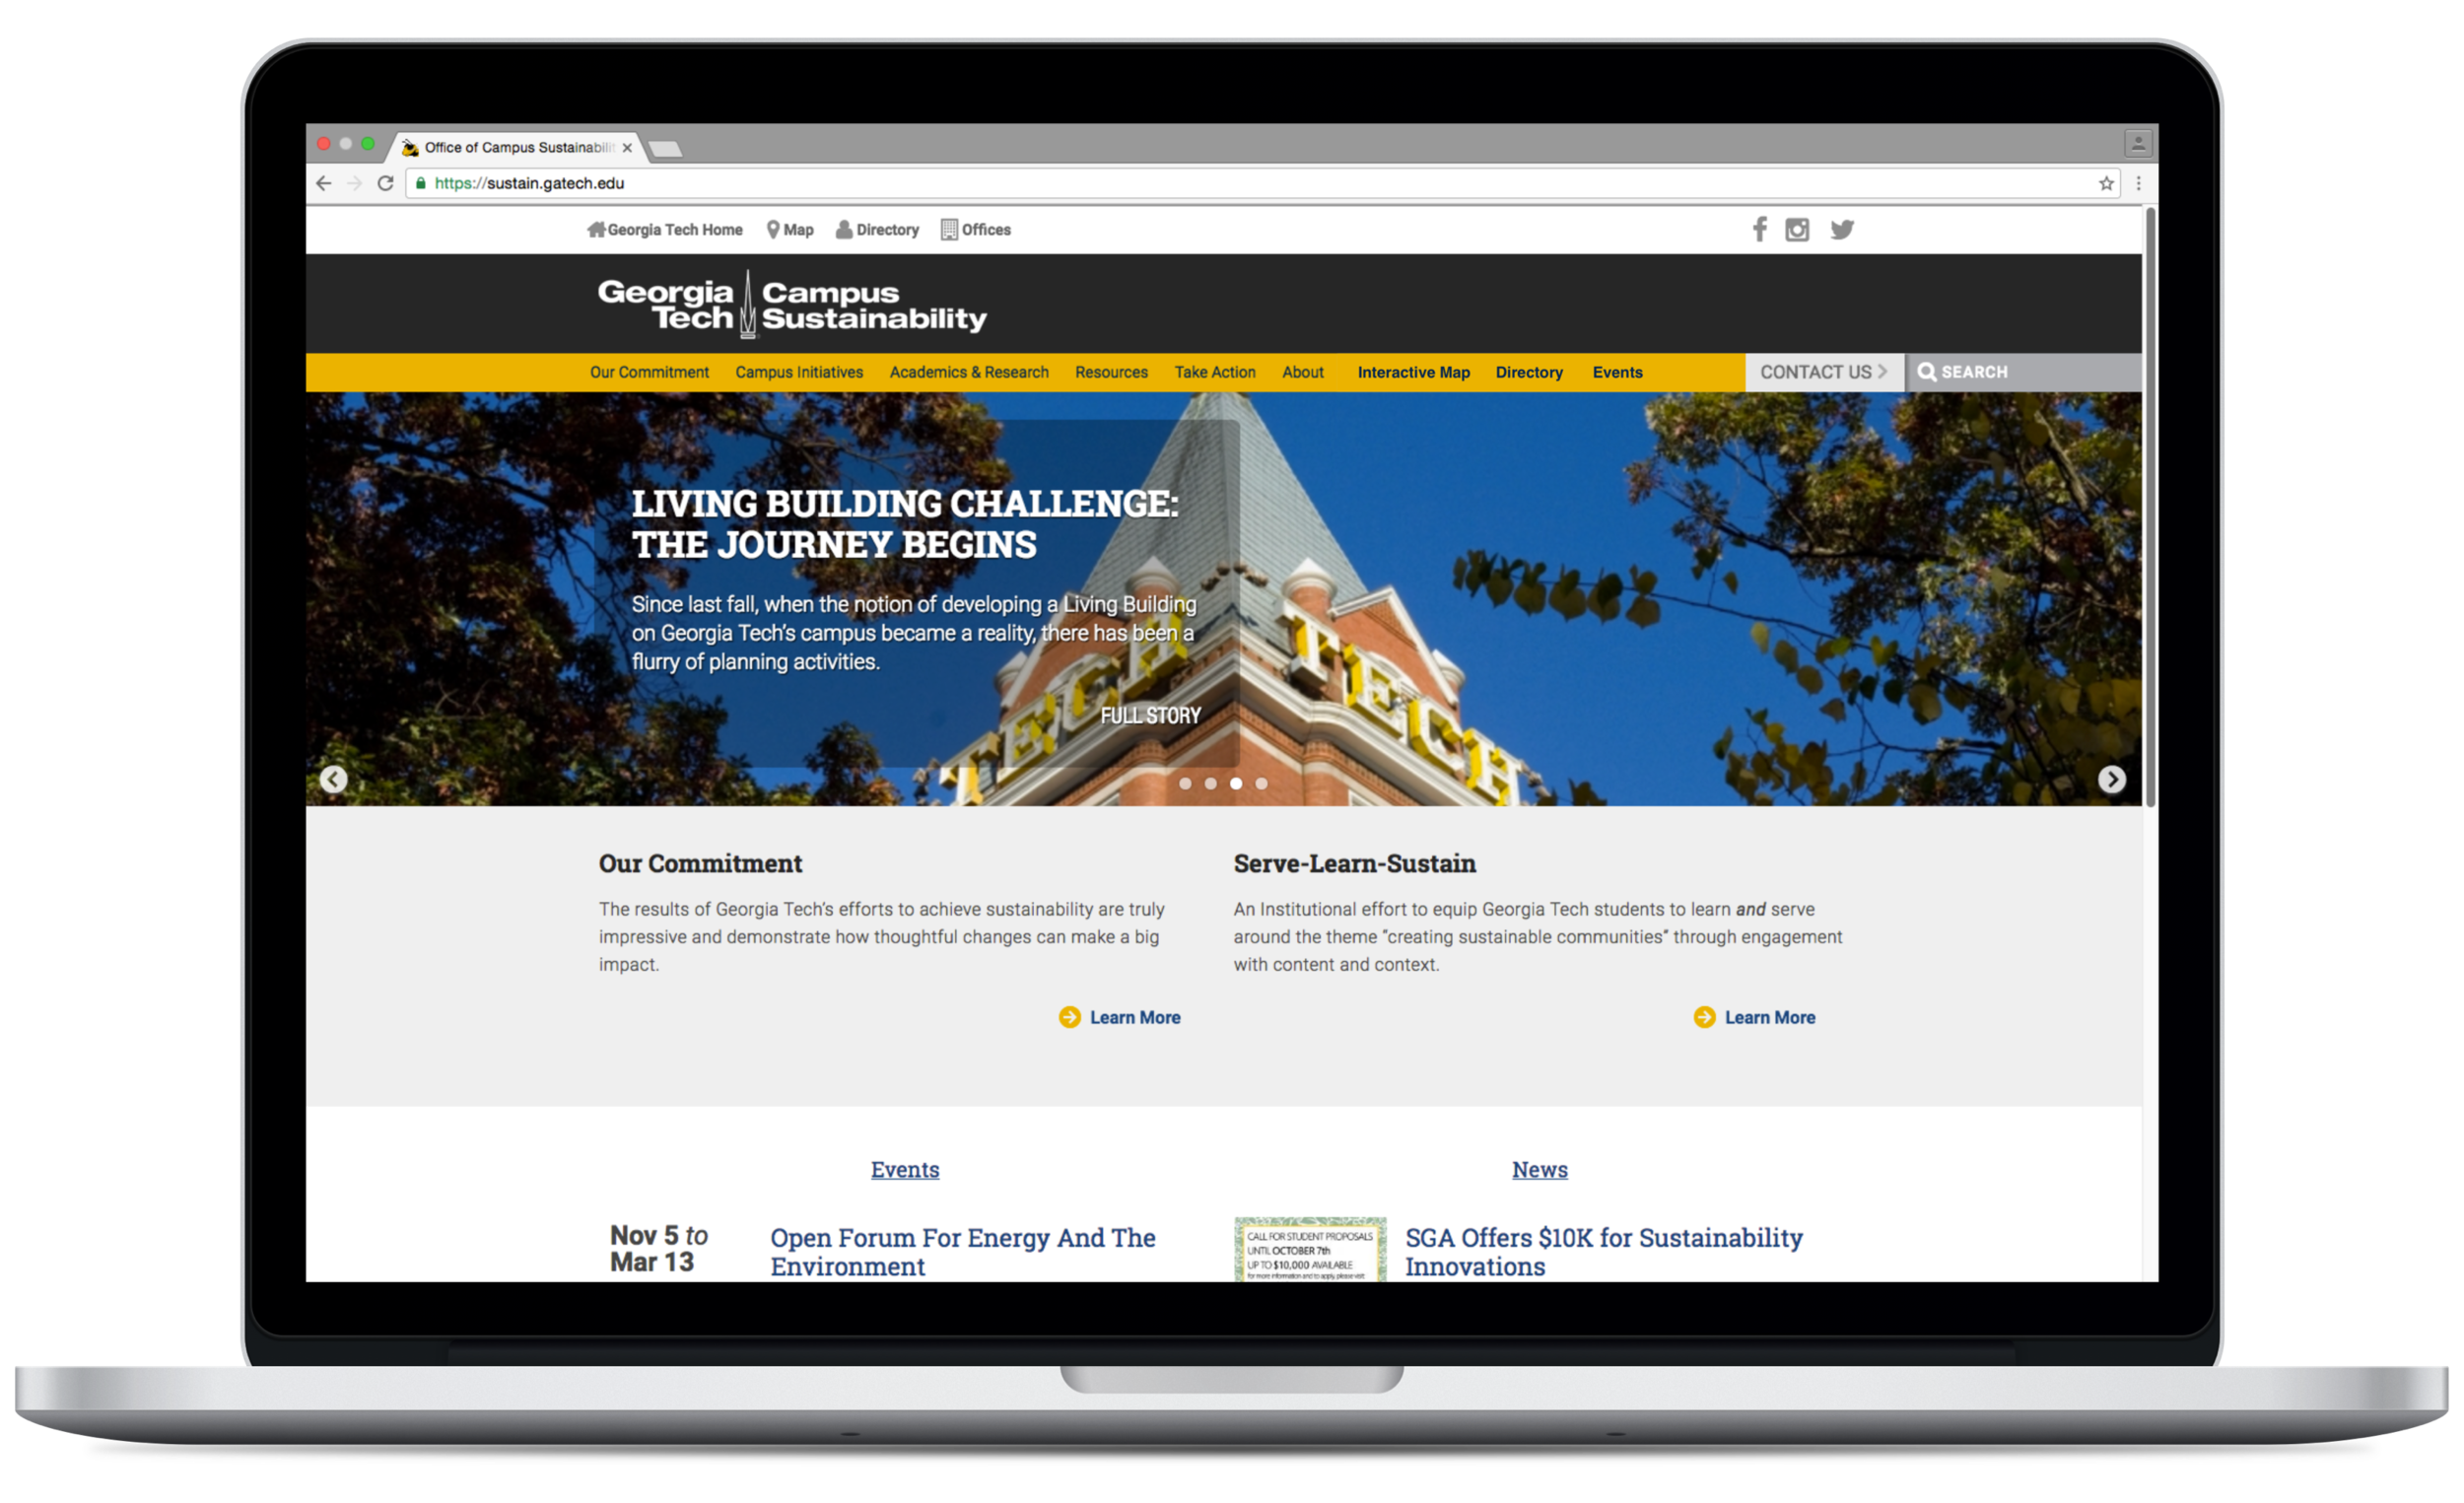
After the ideation phase, I created a design suggestion which effectively integrated the main parts of our solution (visualization, directory, and events) into the existing information architecture of Georgia Tech’s Office of Campus Sustainability website. The suggested solution was derived directly from the previously defined product requirements.
In addition, during our meetings, we established the SW architecture and the data flow of our solution:
Early Feedback
To receive feedback on our design, we presented our work to our peers and met with technical representatives from the Office of Campus Sustainability at Georgia Tech. The main feedback we received was:
Avoid using redundant databases - from the image above, one can see that in order to use Kumu for data visualization, we stored our data not only in MySQL, but also in Google Sheets. This SW design decision could potentially cause future maintenance problems and we were advised against it.
Implement the server side using PHP, but not Java - we initially planned to implement our server side using Java since our developers were more familiar with this programming language. However, during our research, we found out that Georgia Tech’s servers use PHP. Therefore, we had to comply with the existing technology.
We adopted both suggestions and changed our design and implementation accordingly.
High Fidelity Prototype
To deliver a functional system in the given timeframe, we decided to limit the project scope and focus only on the Interactive Map and the Directory (the Event Management feature was removed from our roadmap).
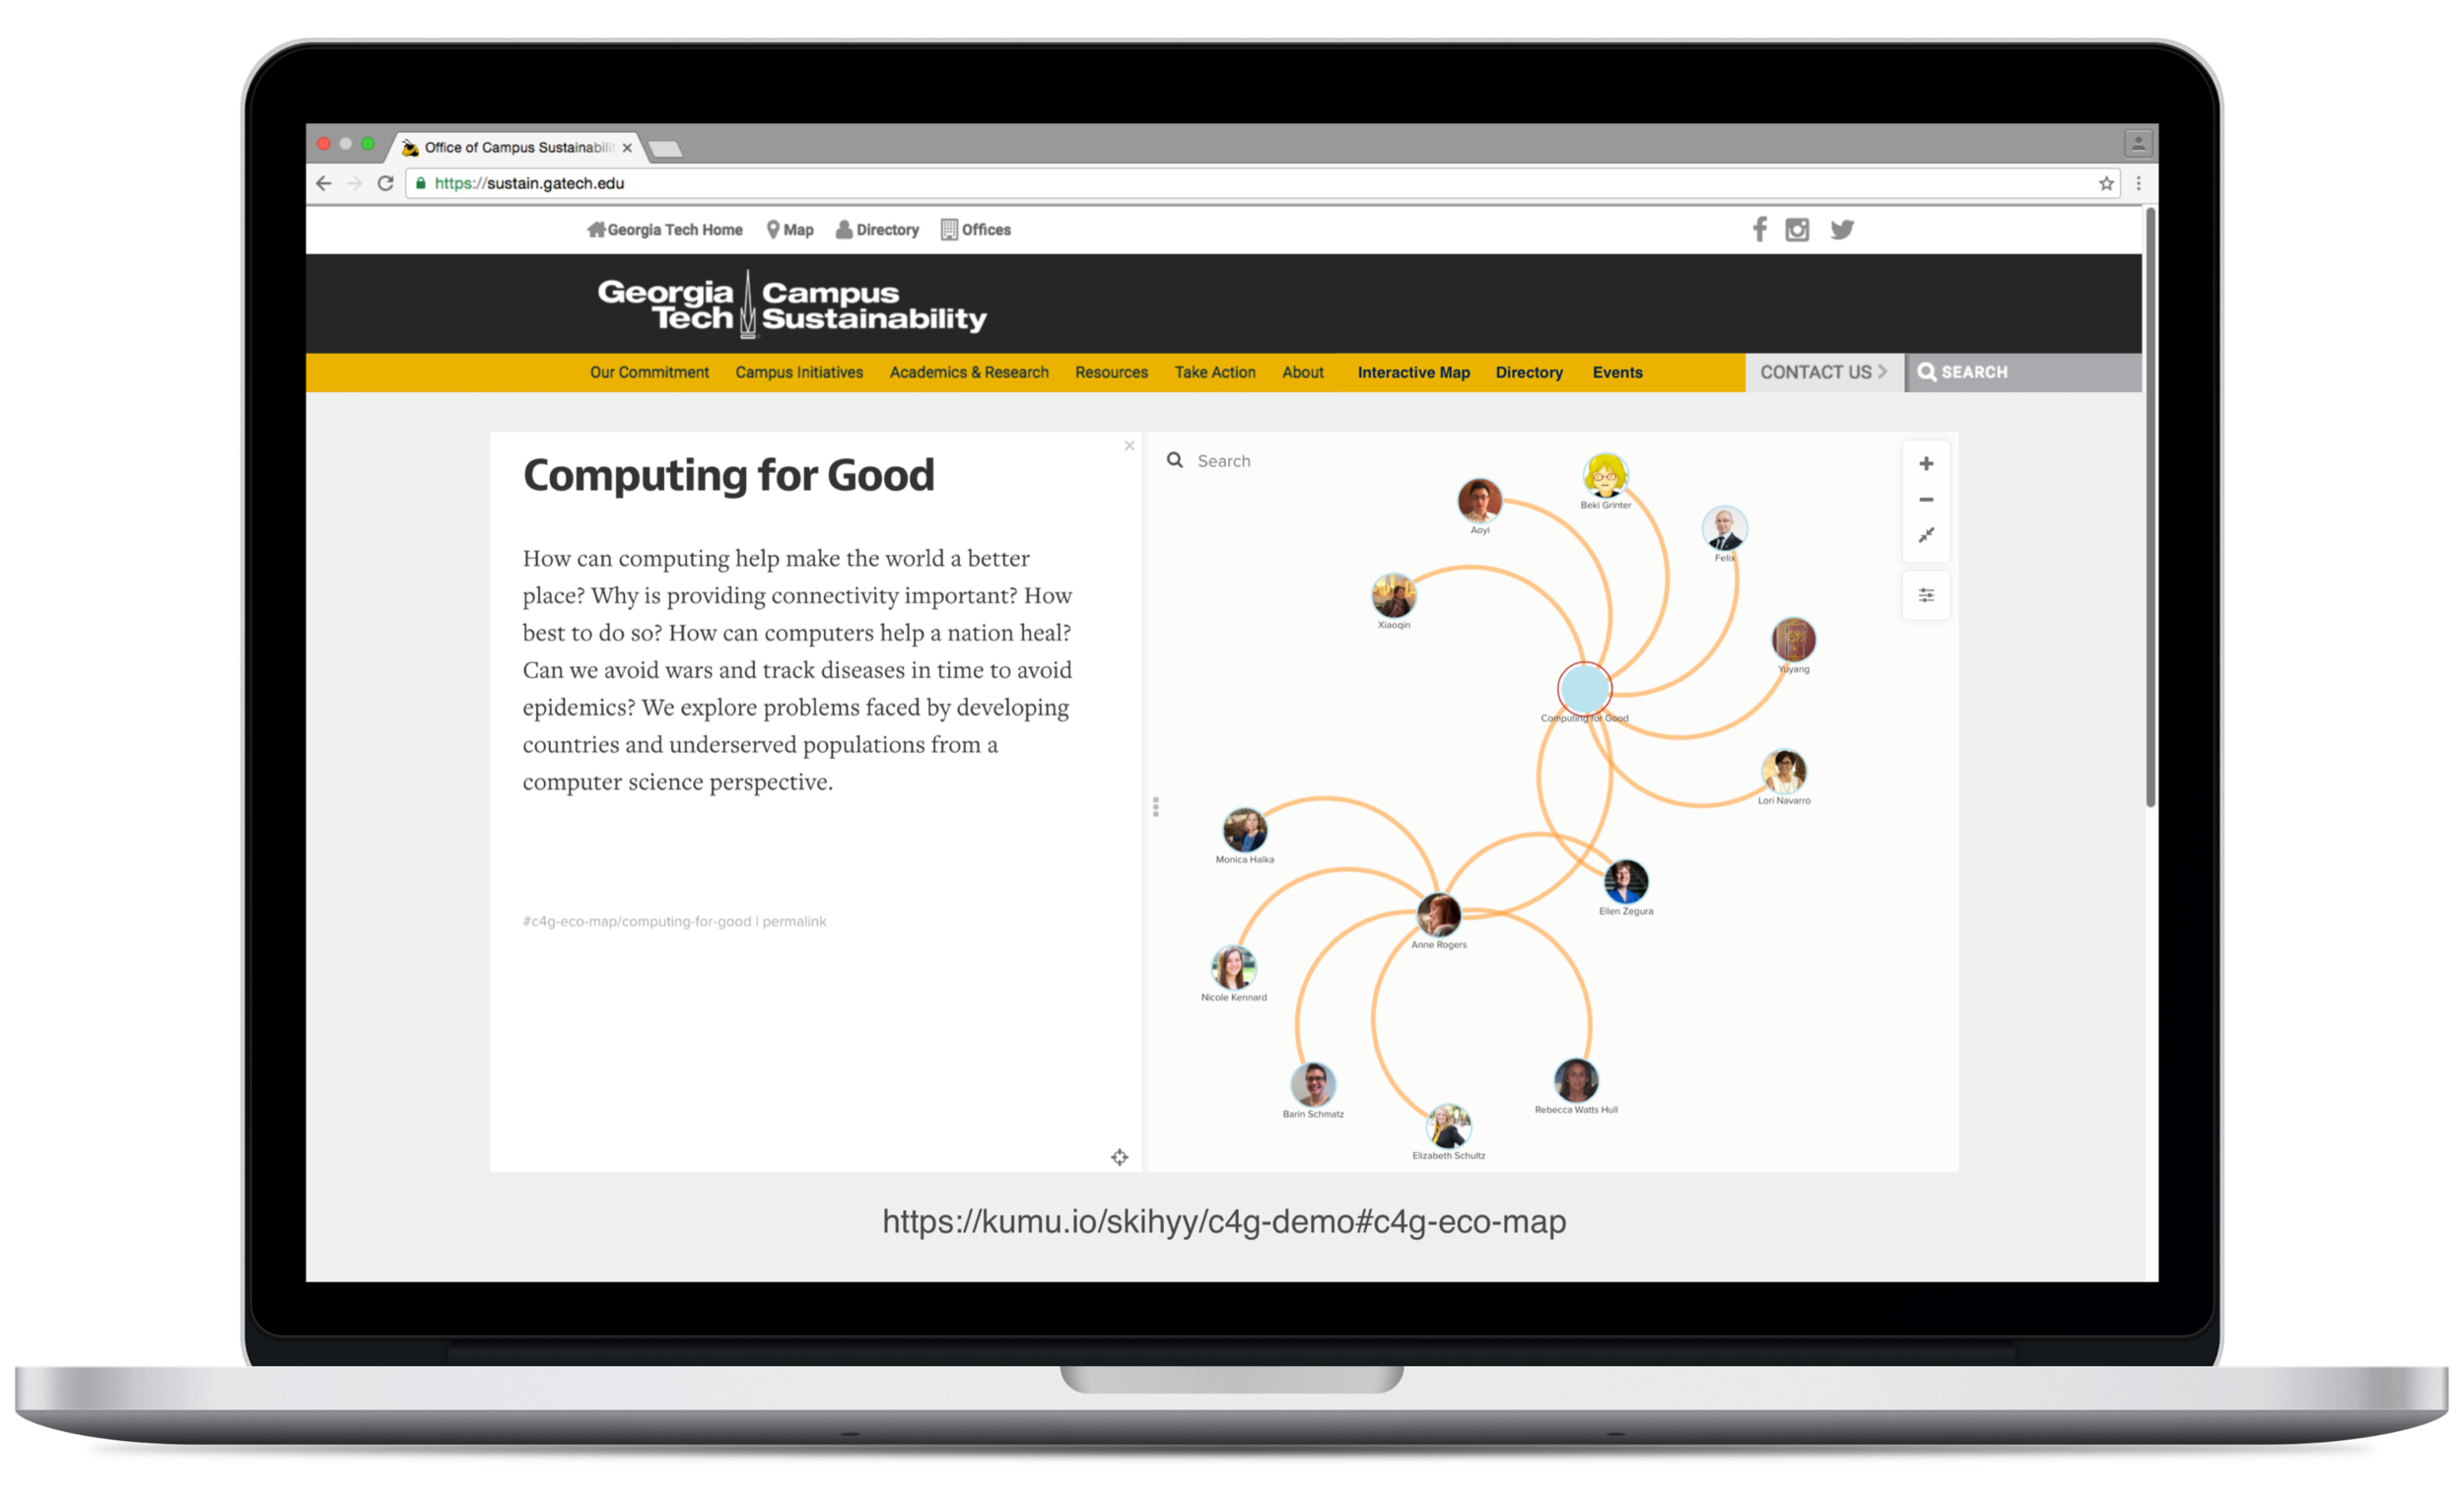
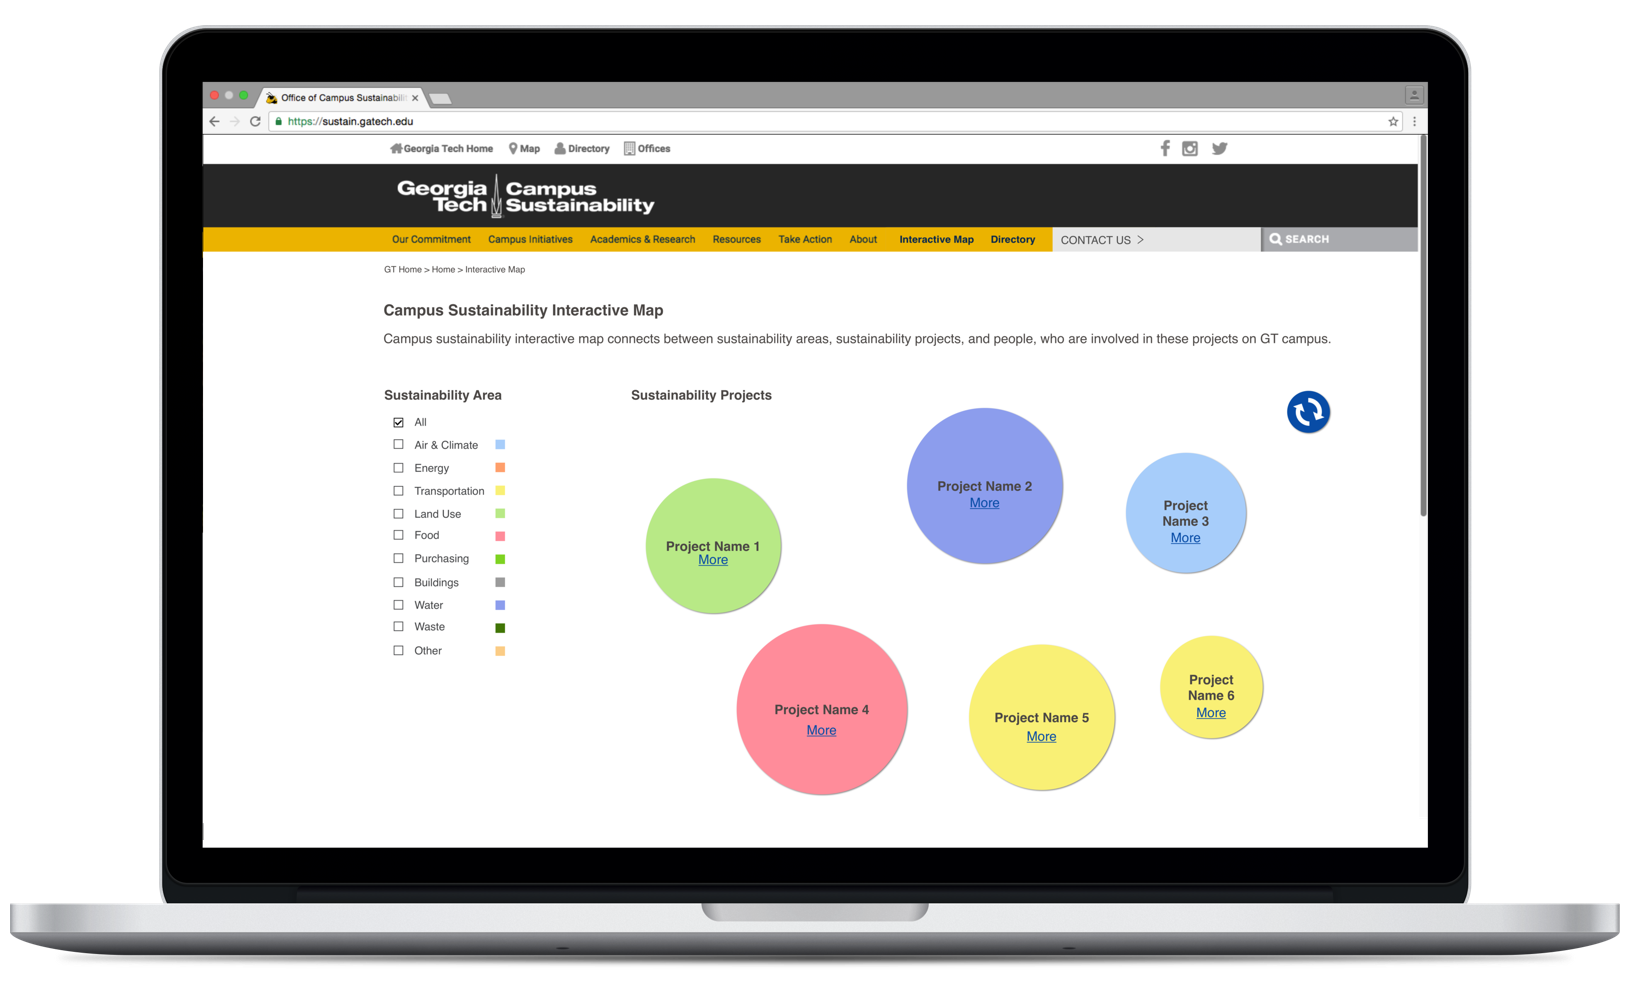
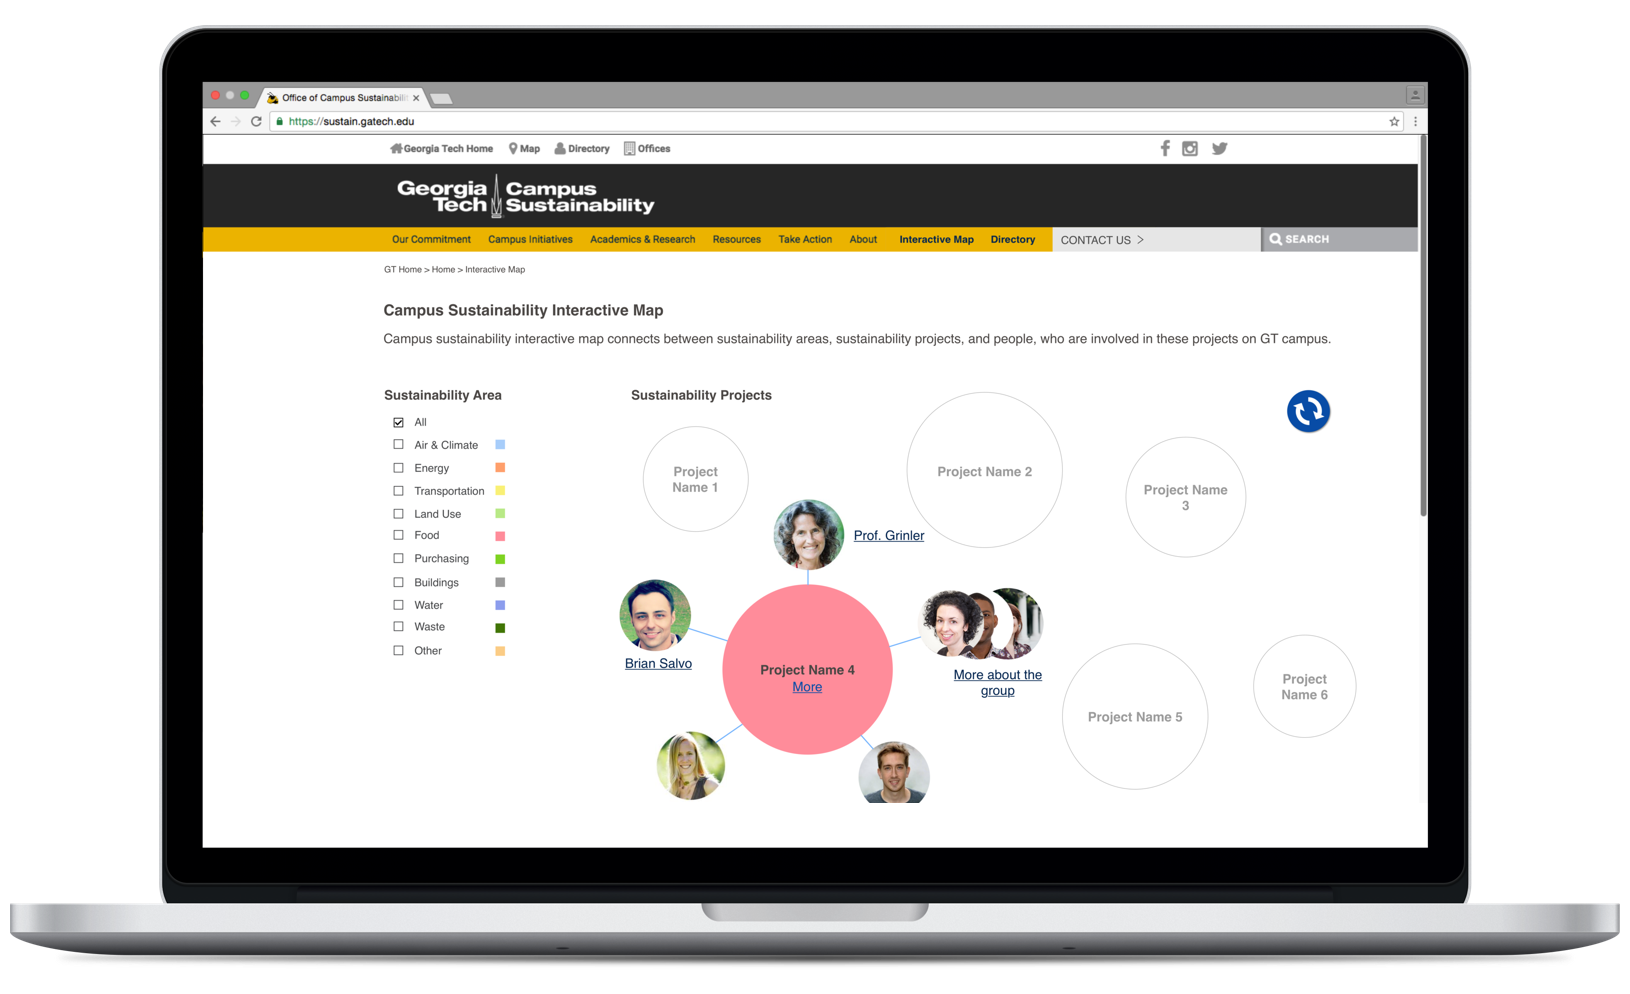
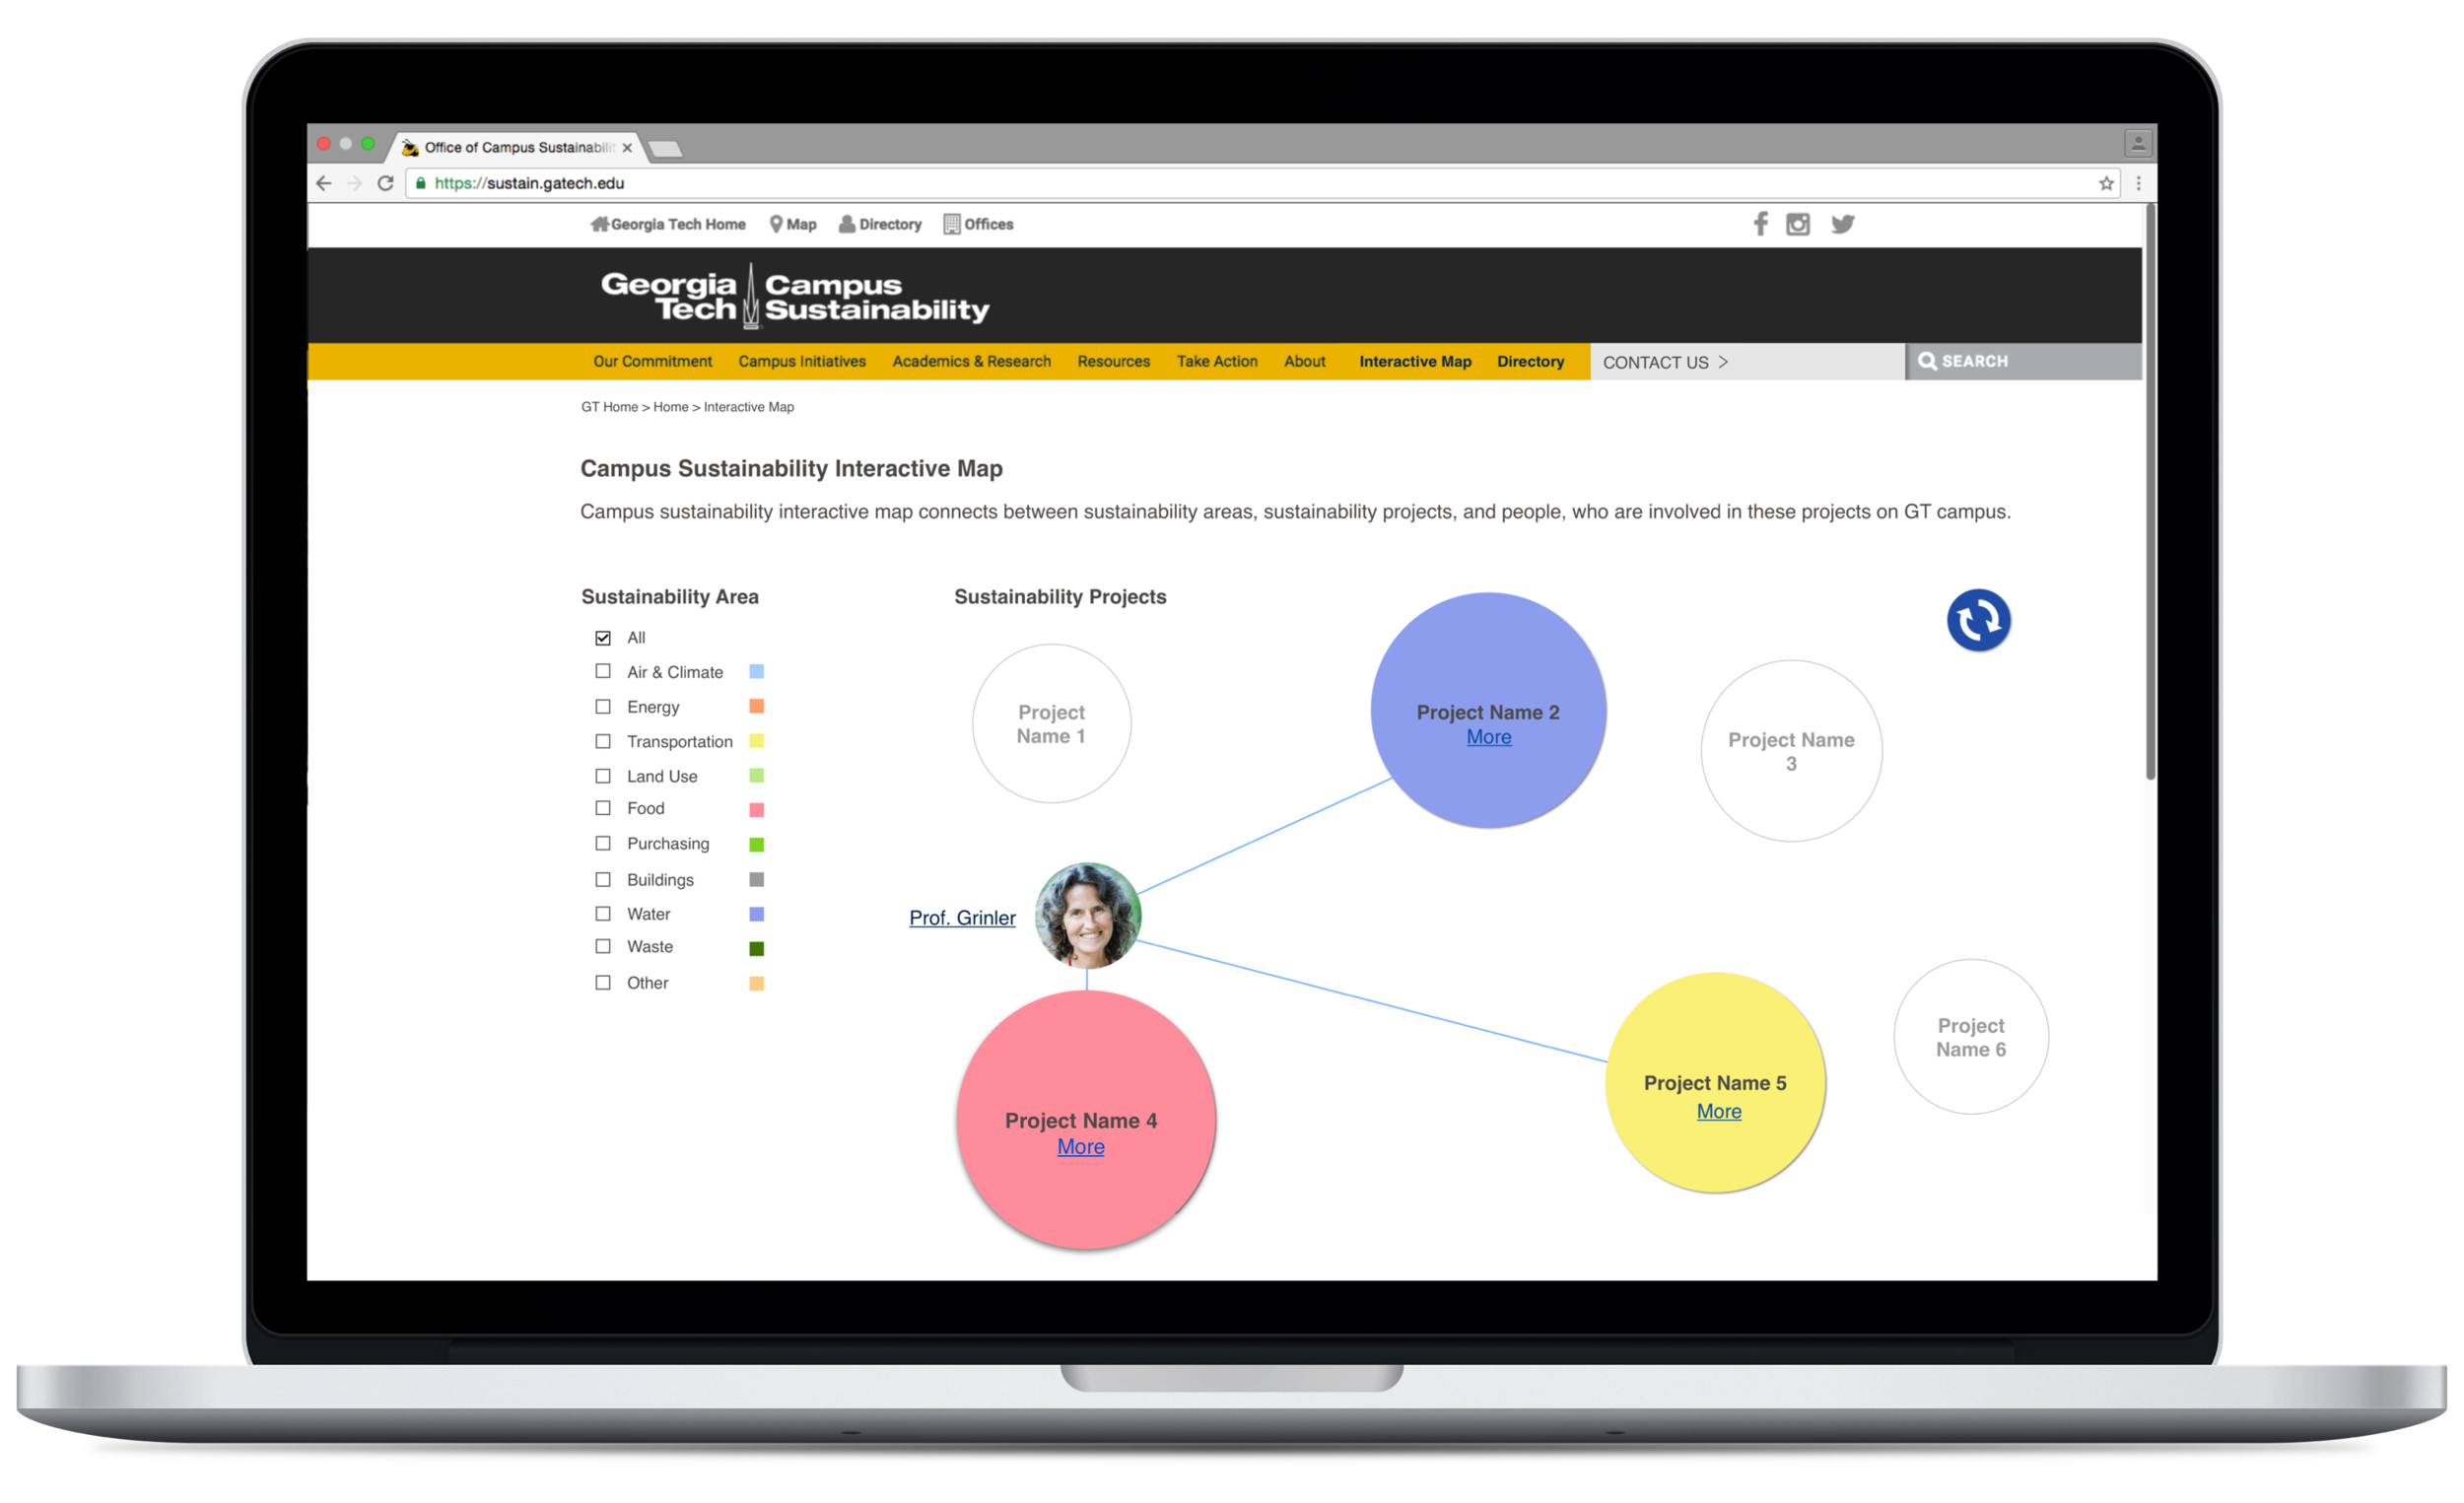
Interactive Map - shows the interconnections between sustainability areas, projects, and people on campus. In order not to overwhelm our users, we represented the sustainability areas as filters (left section on the screens below). By selecting a filter, users can deduce which projects are associated with the selected sustainability area. If users are interested in learning more about a project, they can click on the relevant project bubble and see the professionals and all those who are involved in that particular project. Additionally, if the user wants to see all the projects that a specific person is involved in, they can click on an image that represents this person and readily receive that information.
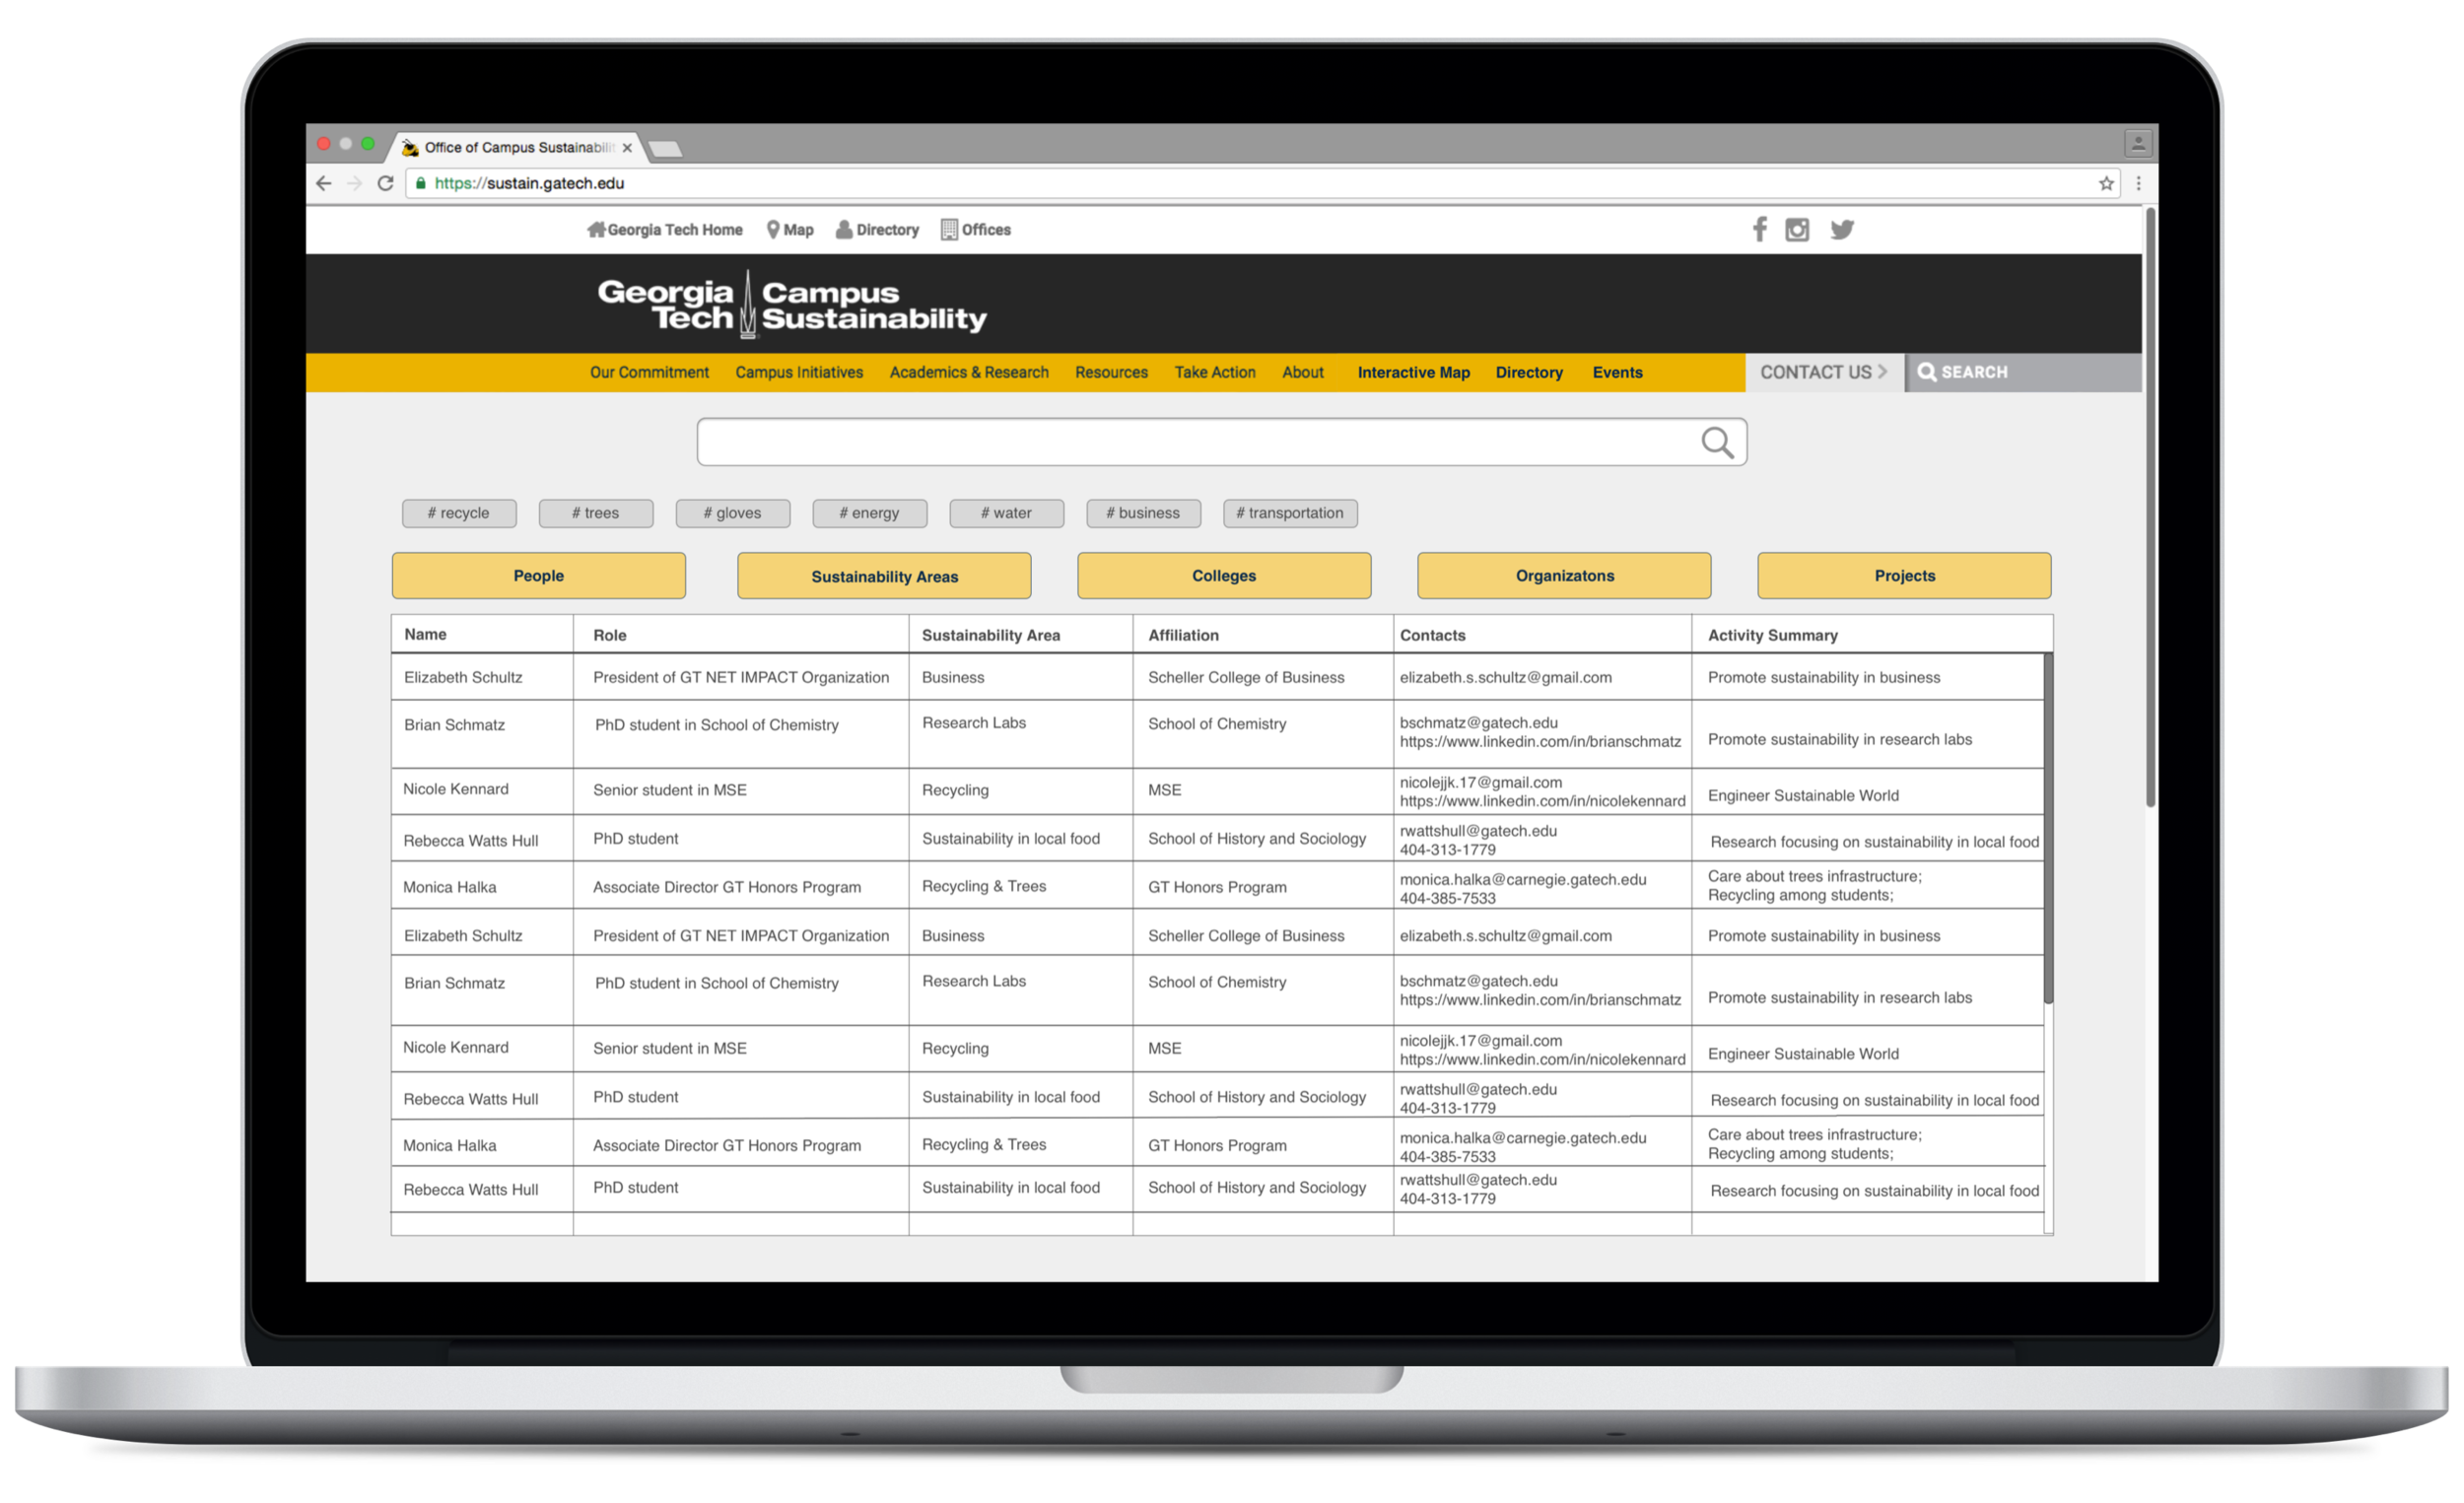
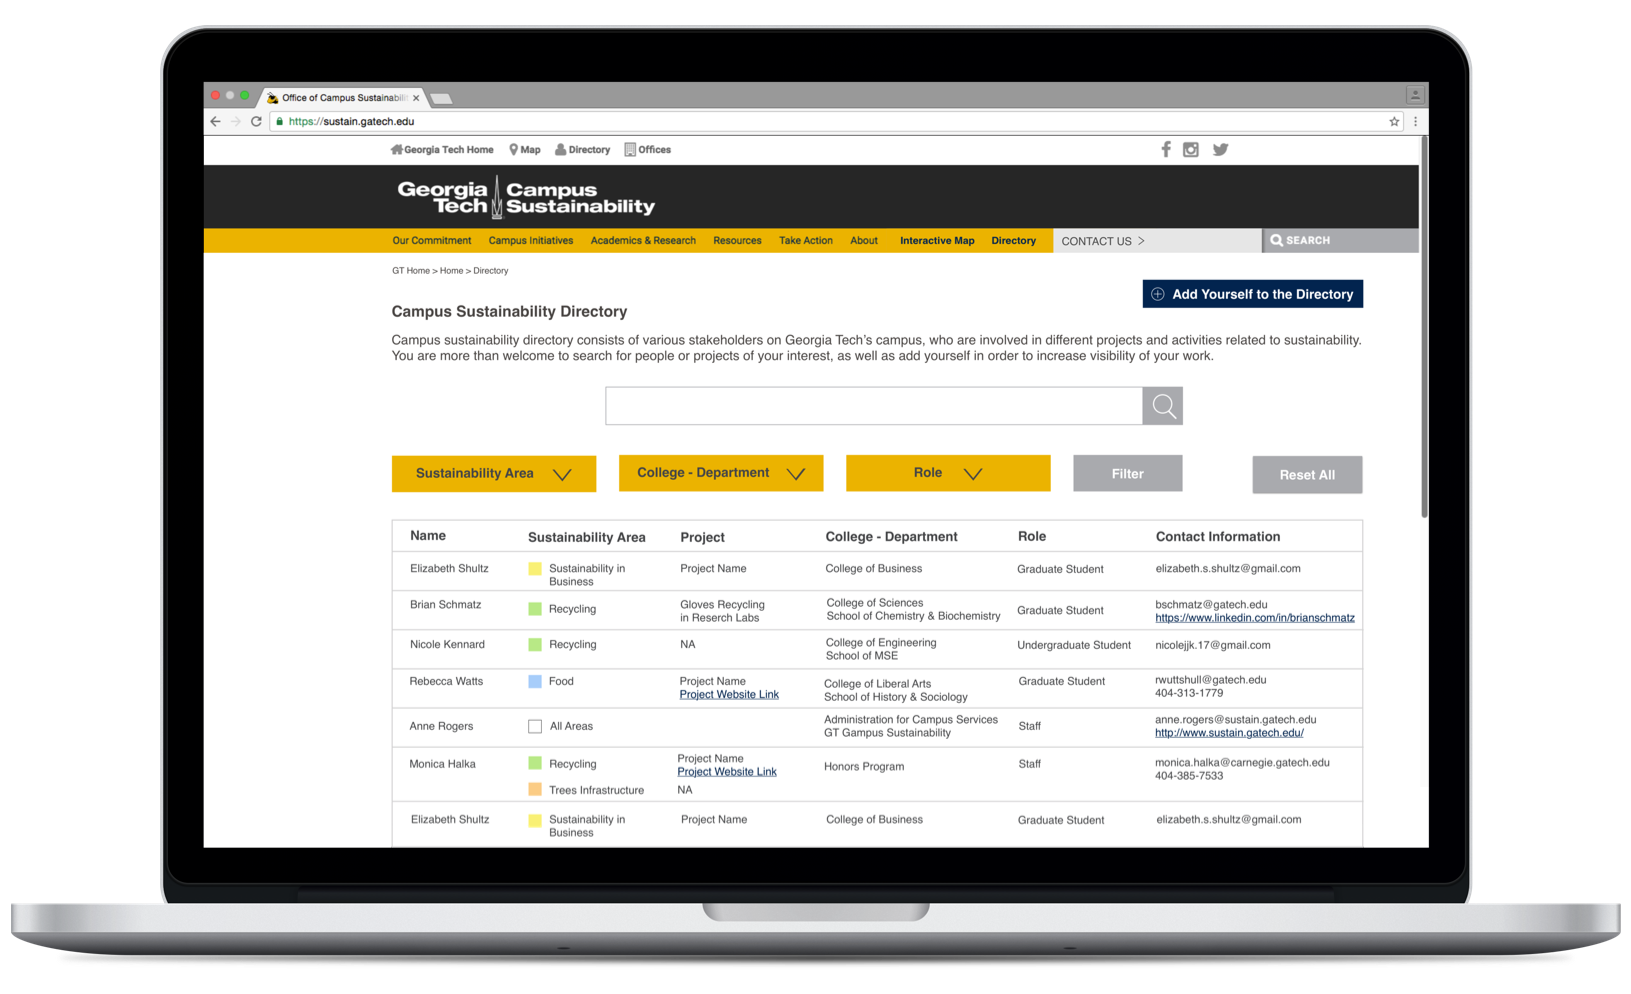
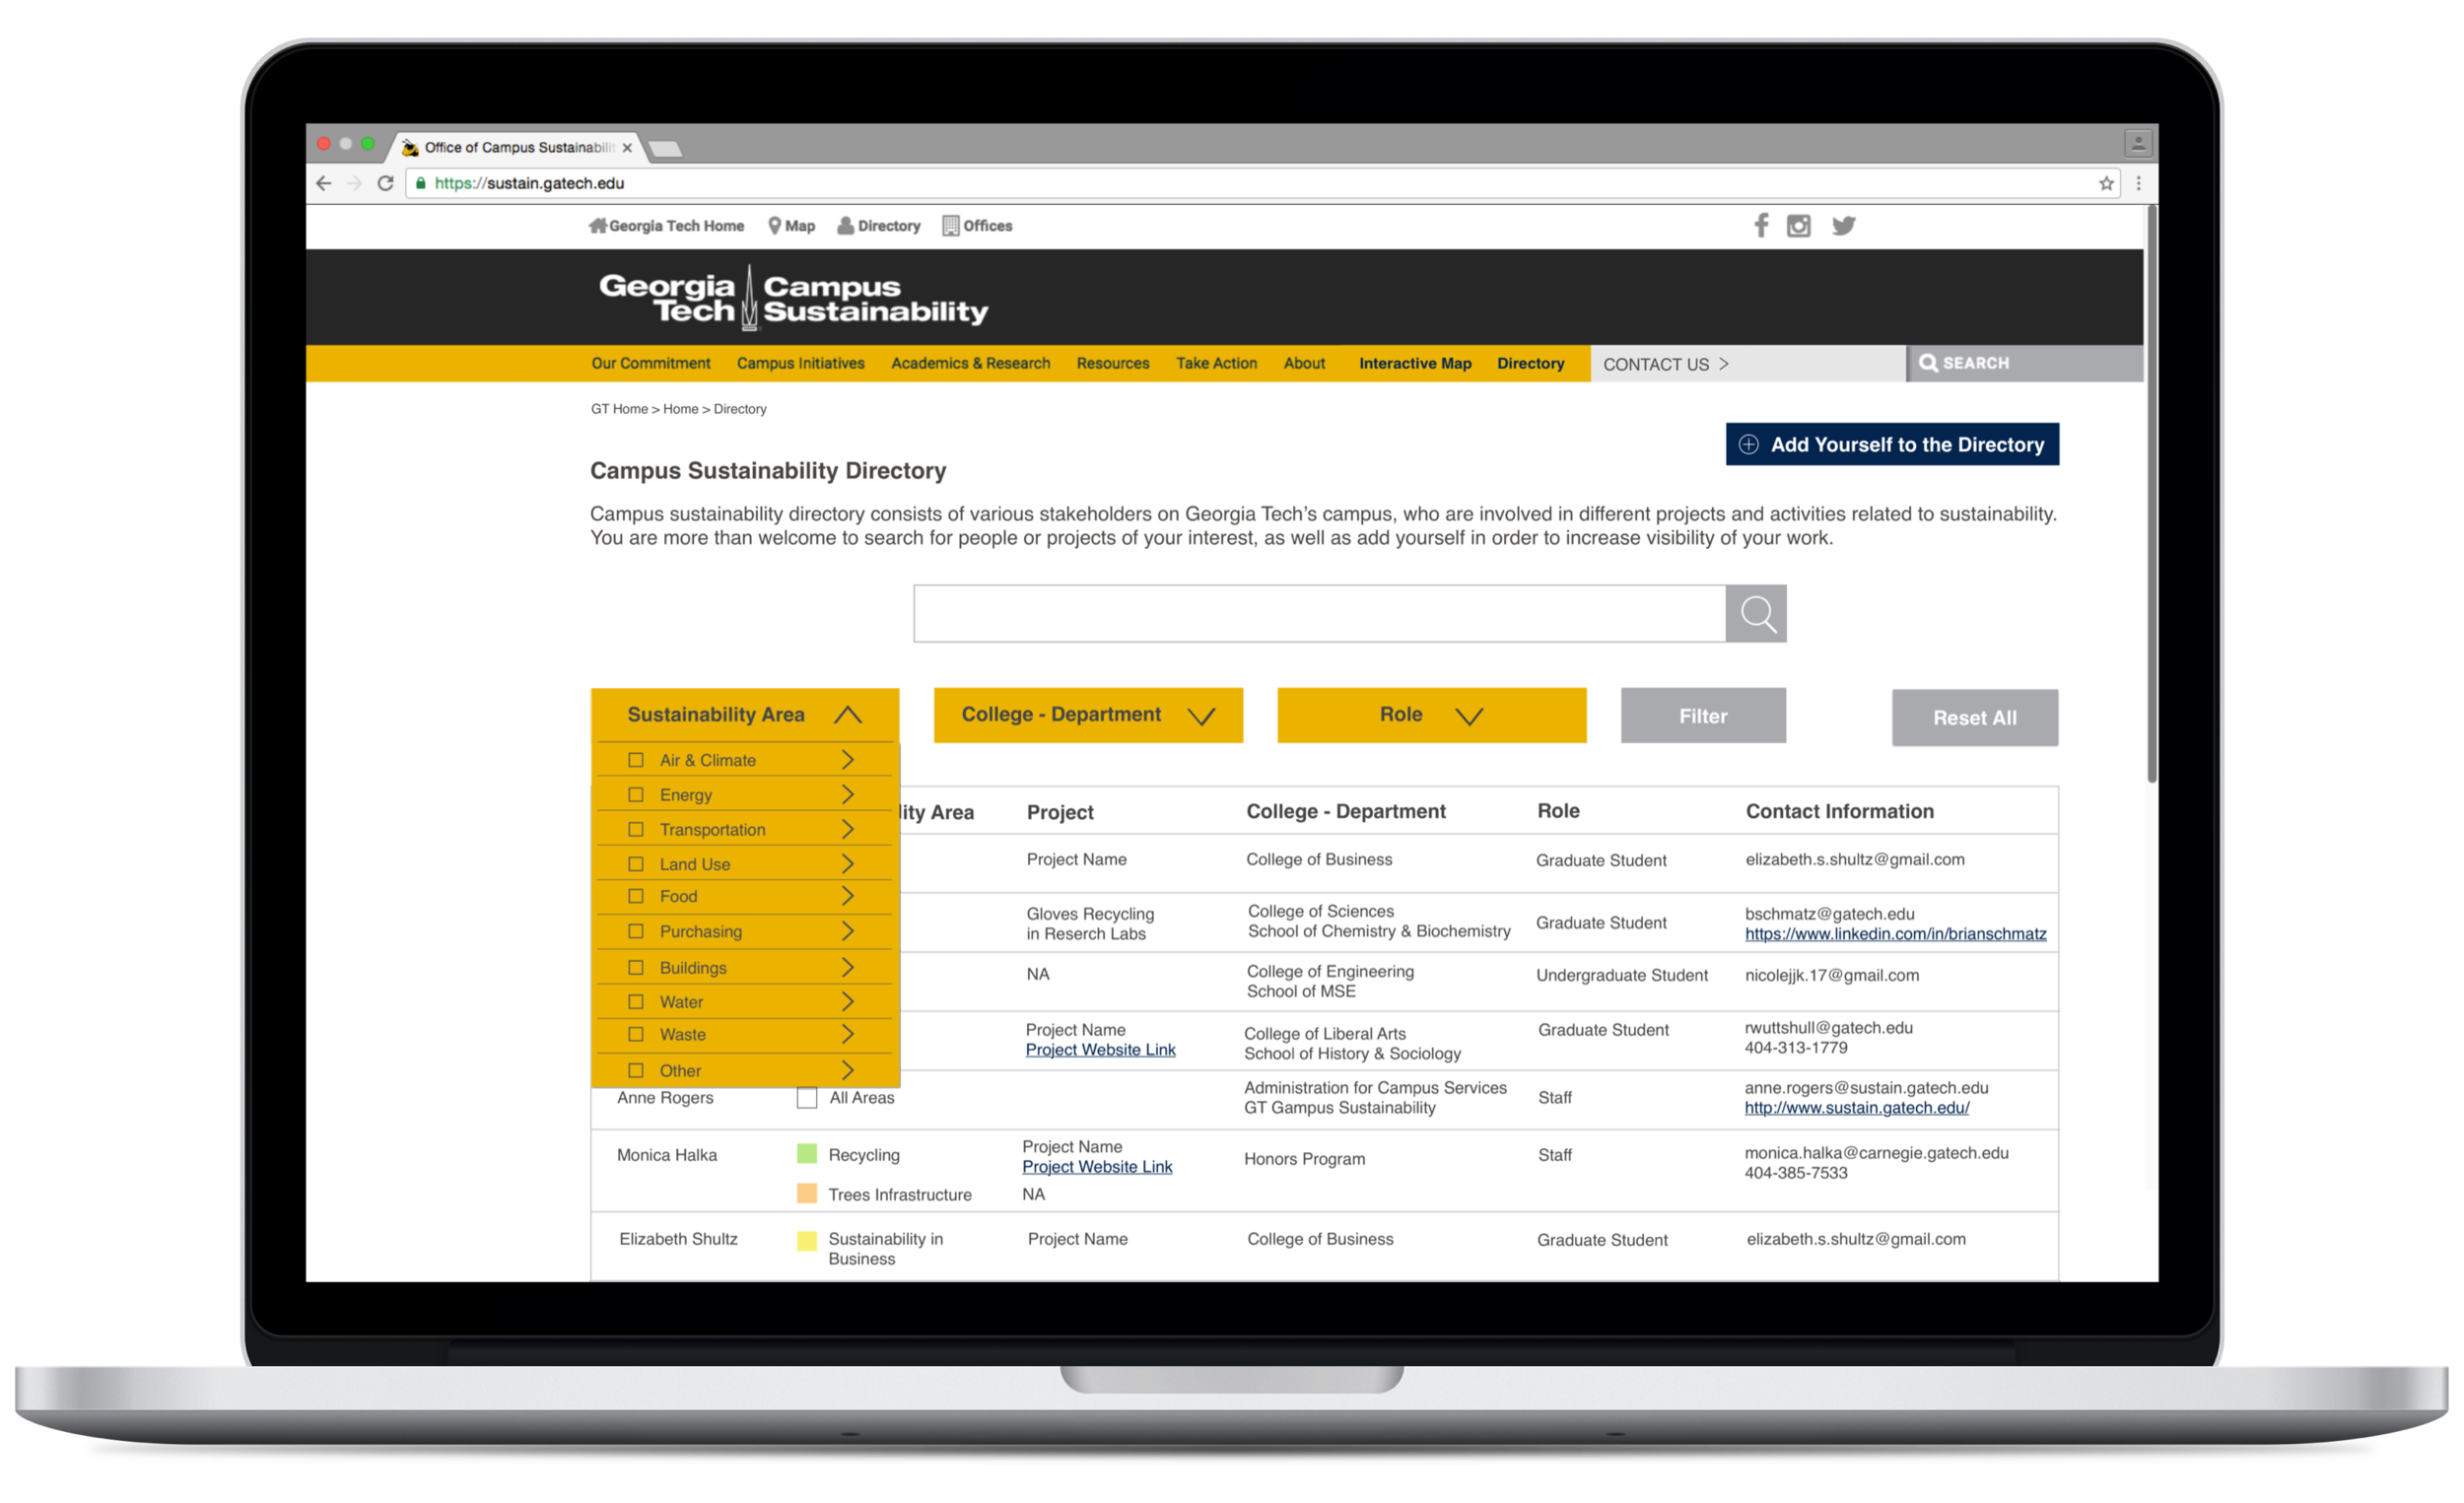
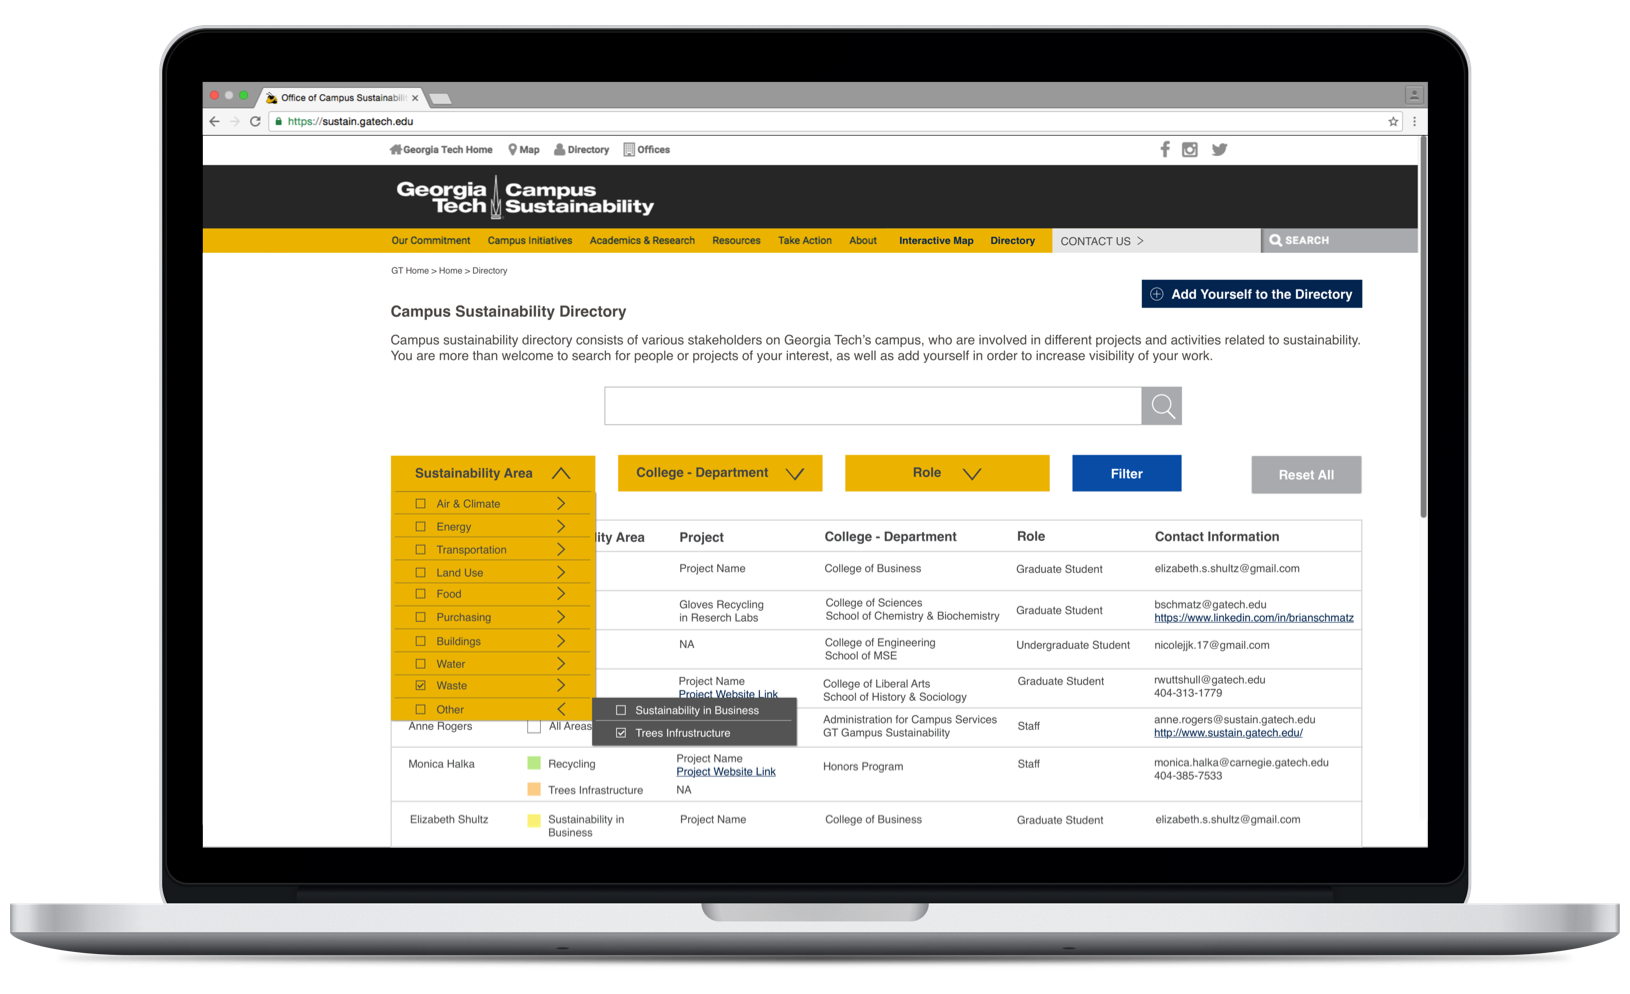
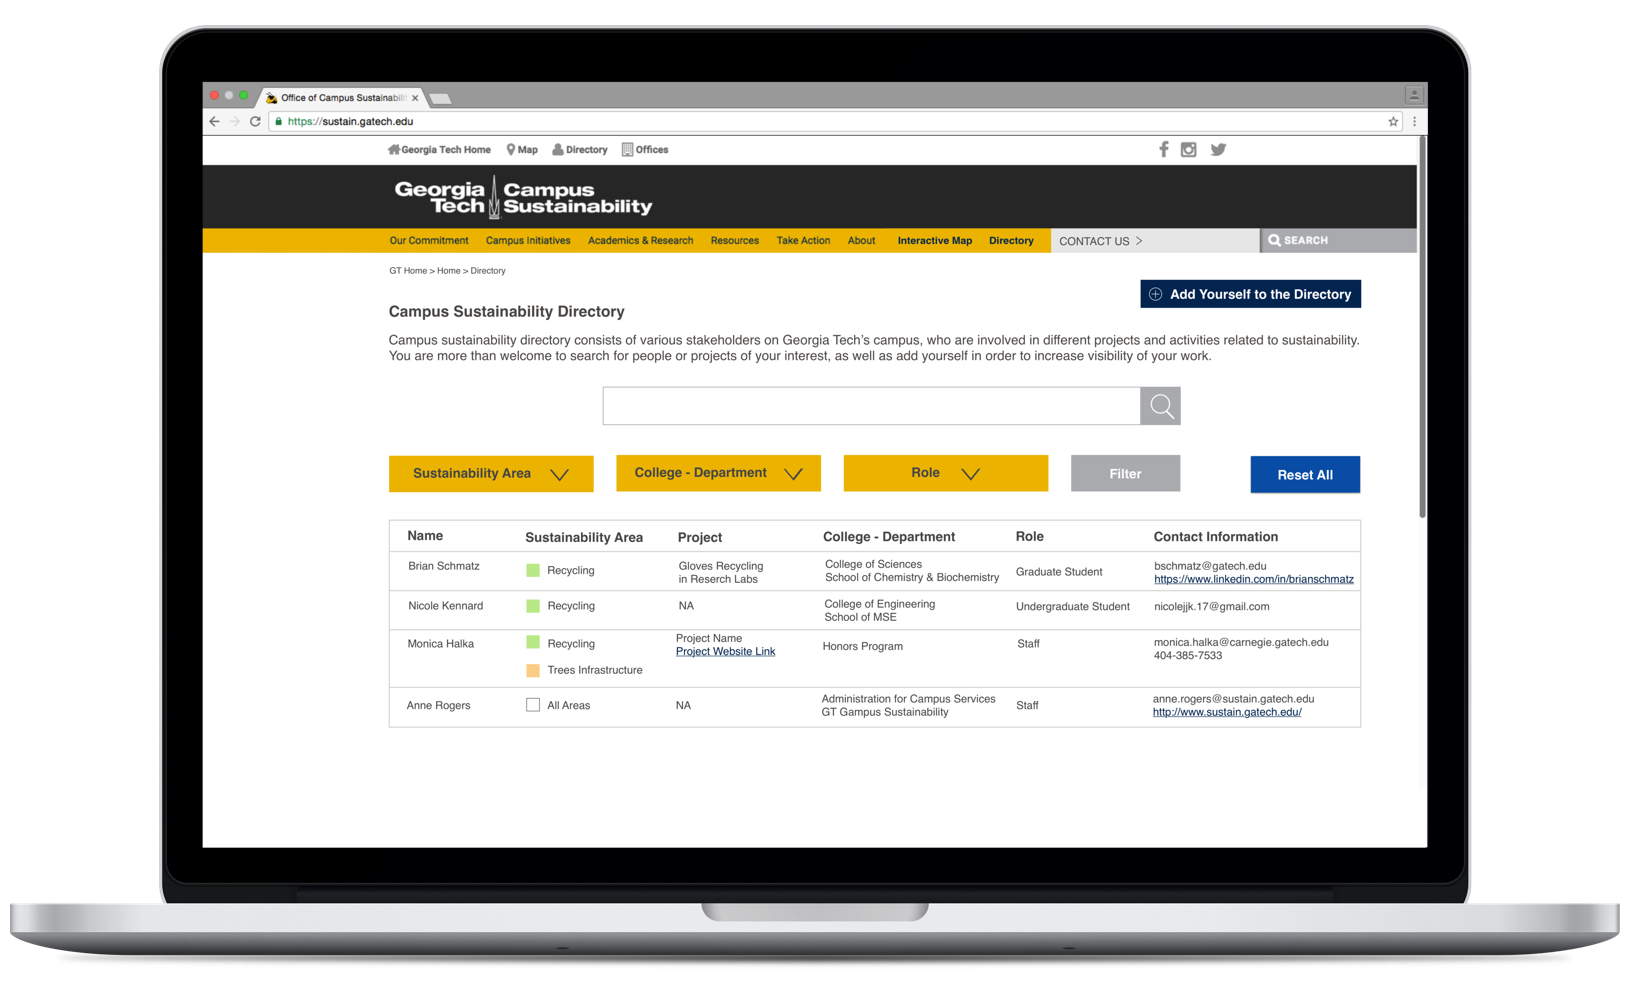
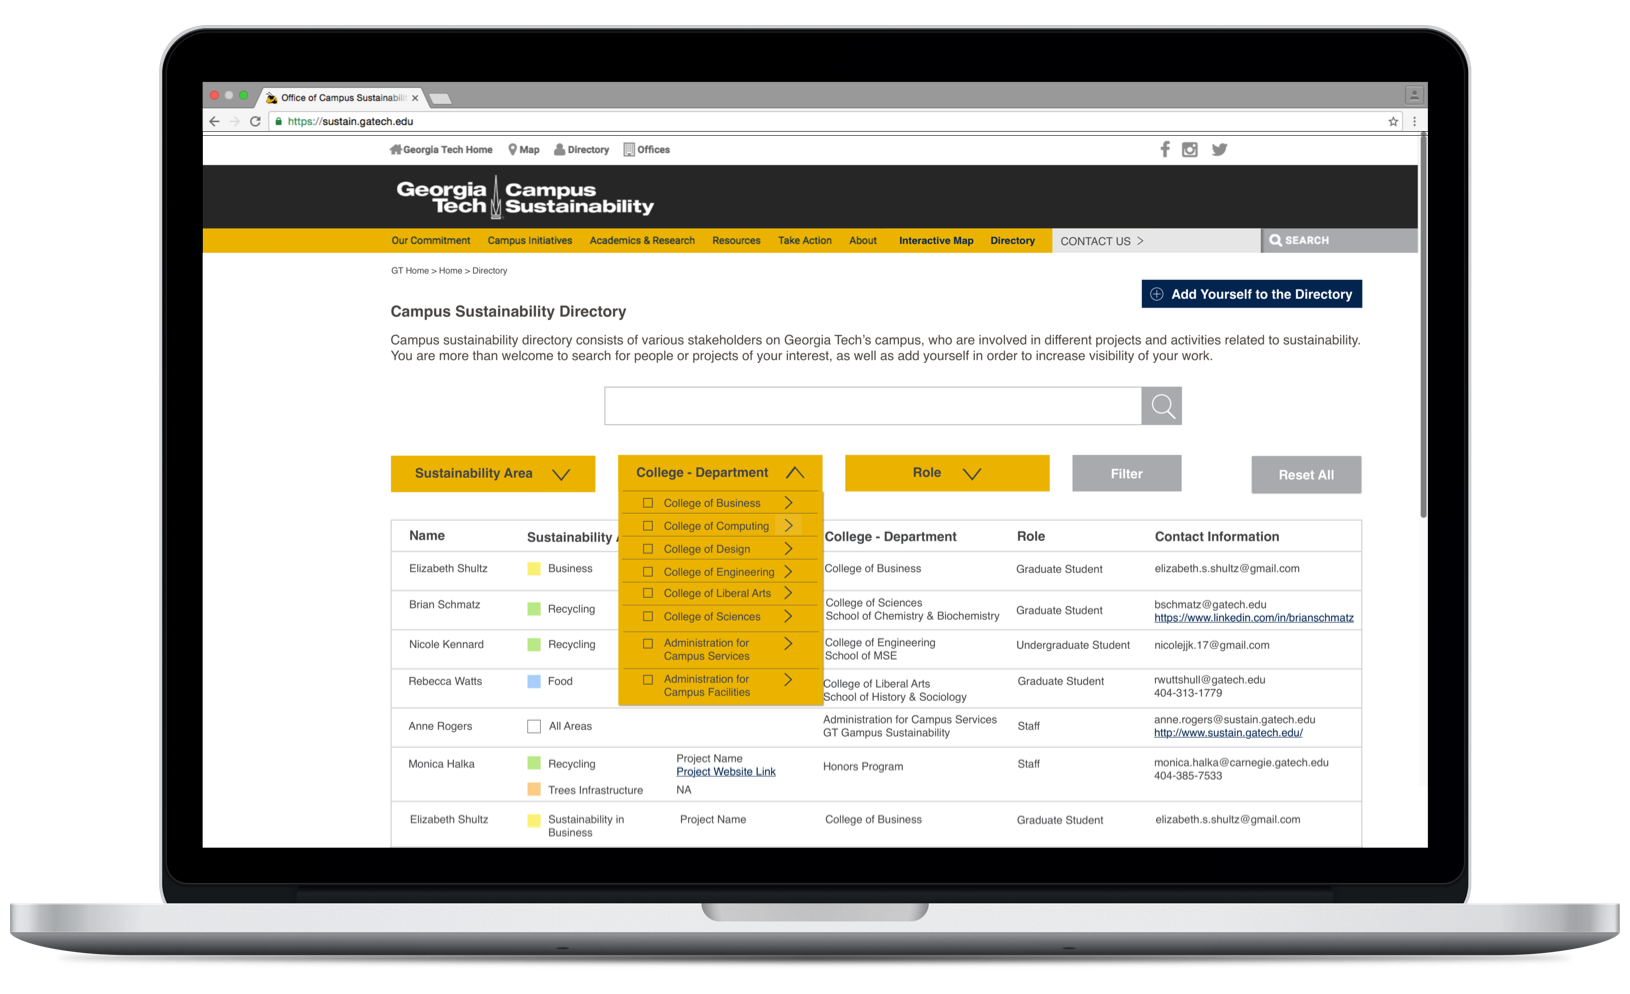
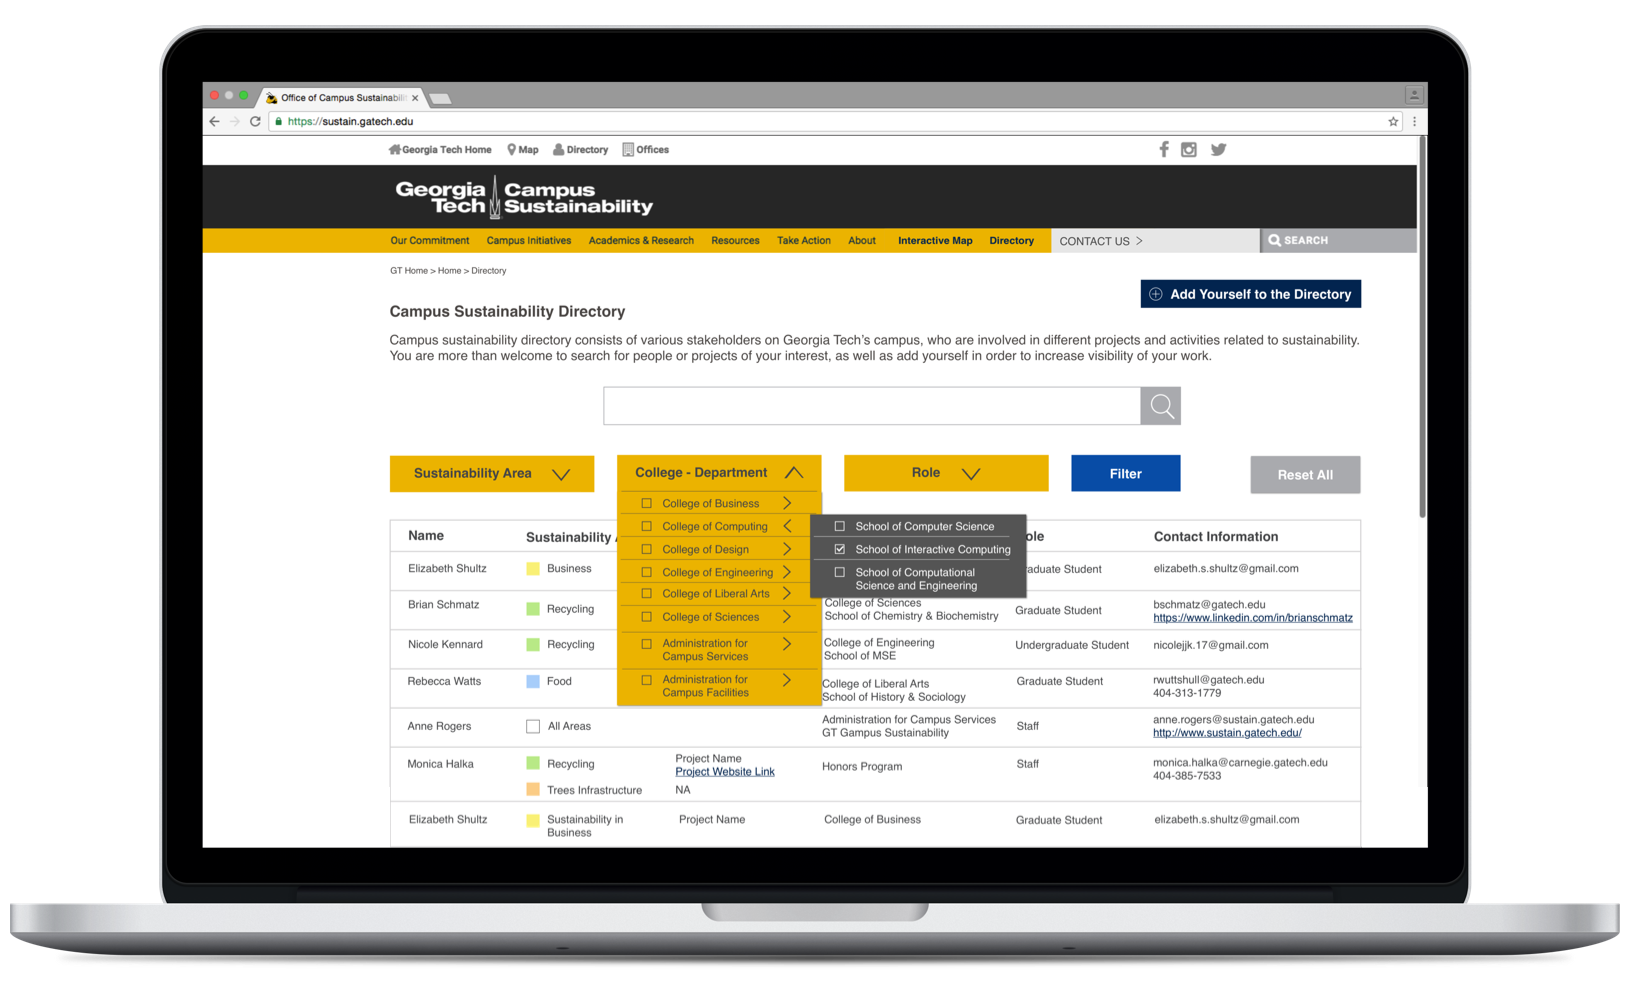
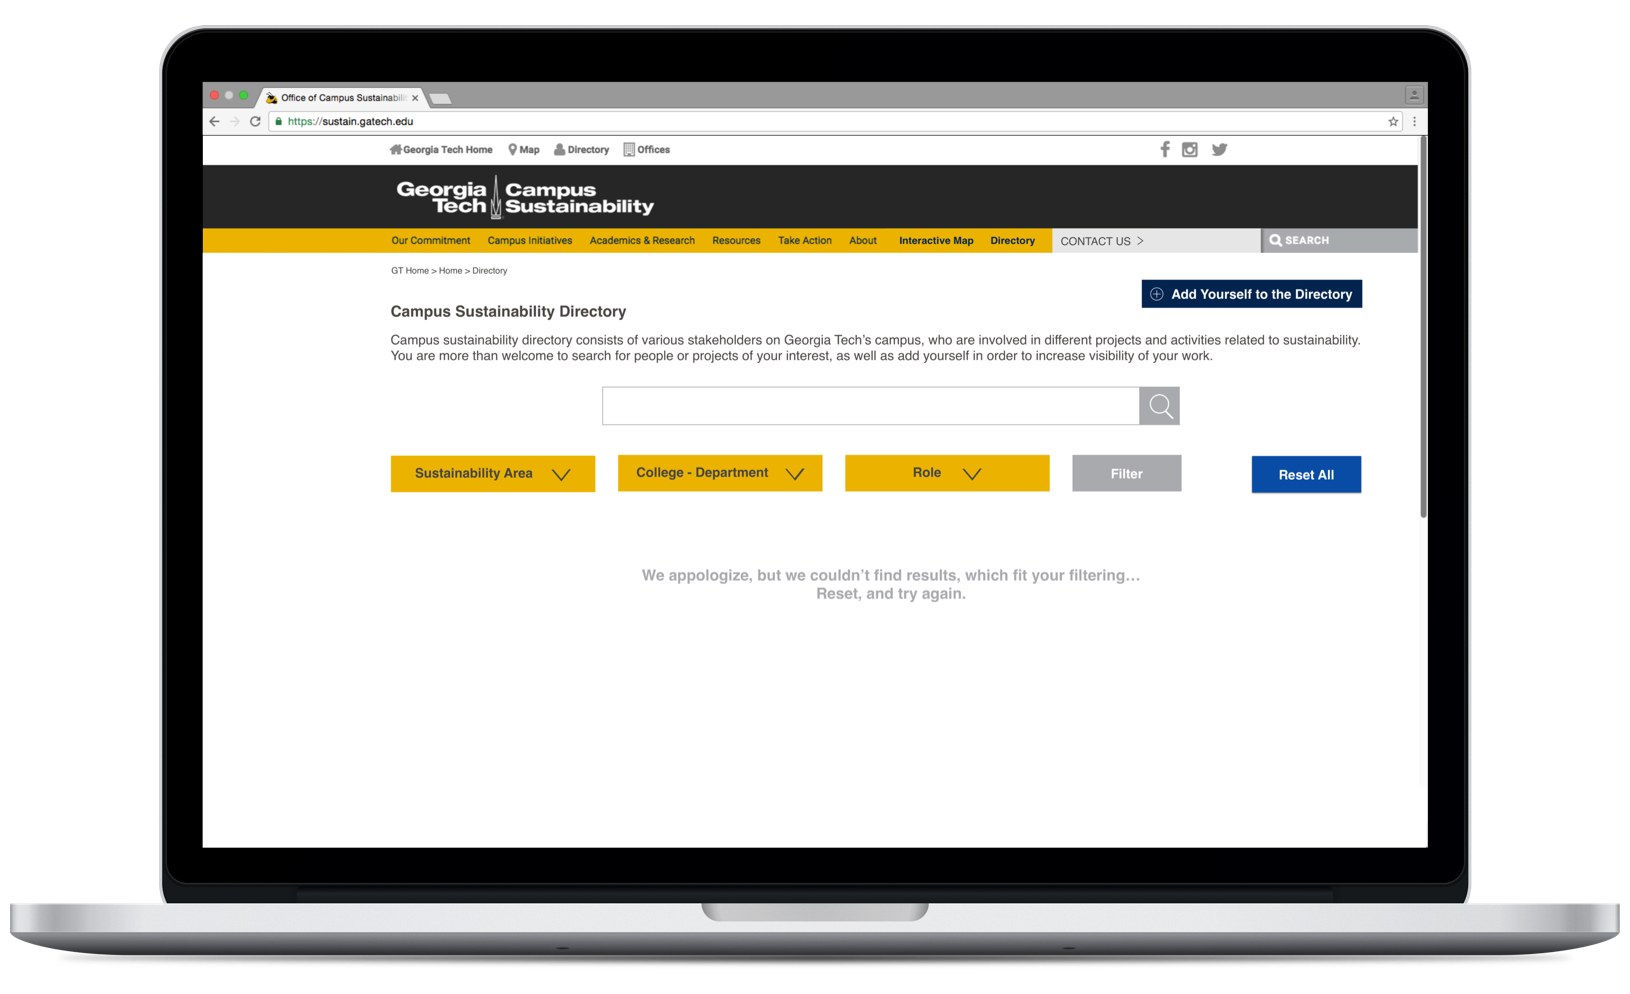
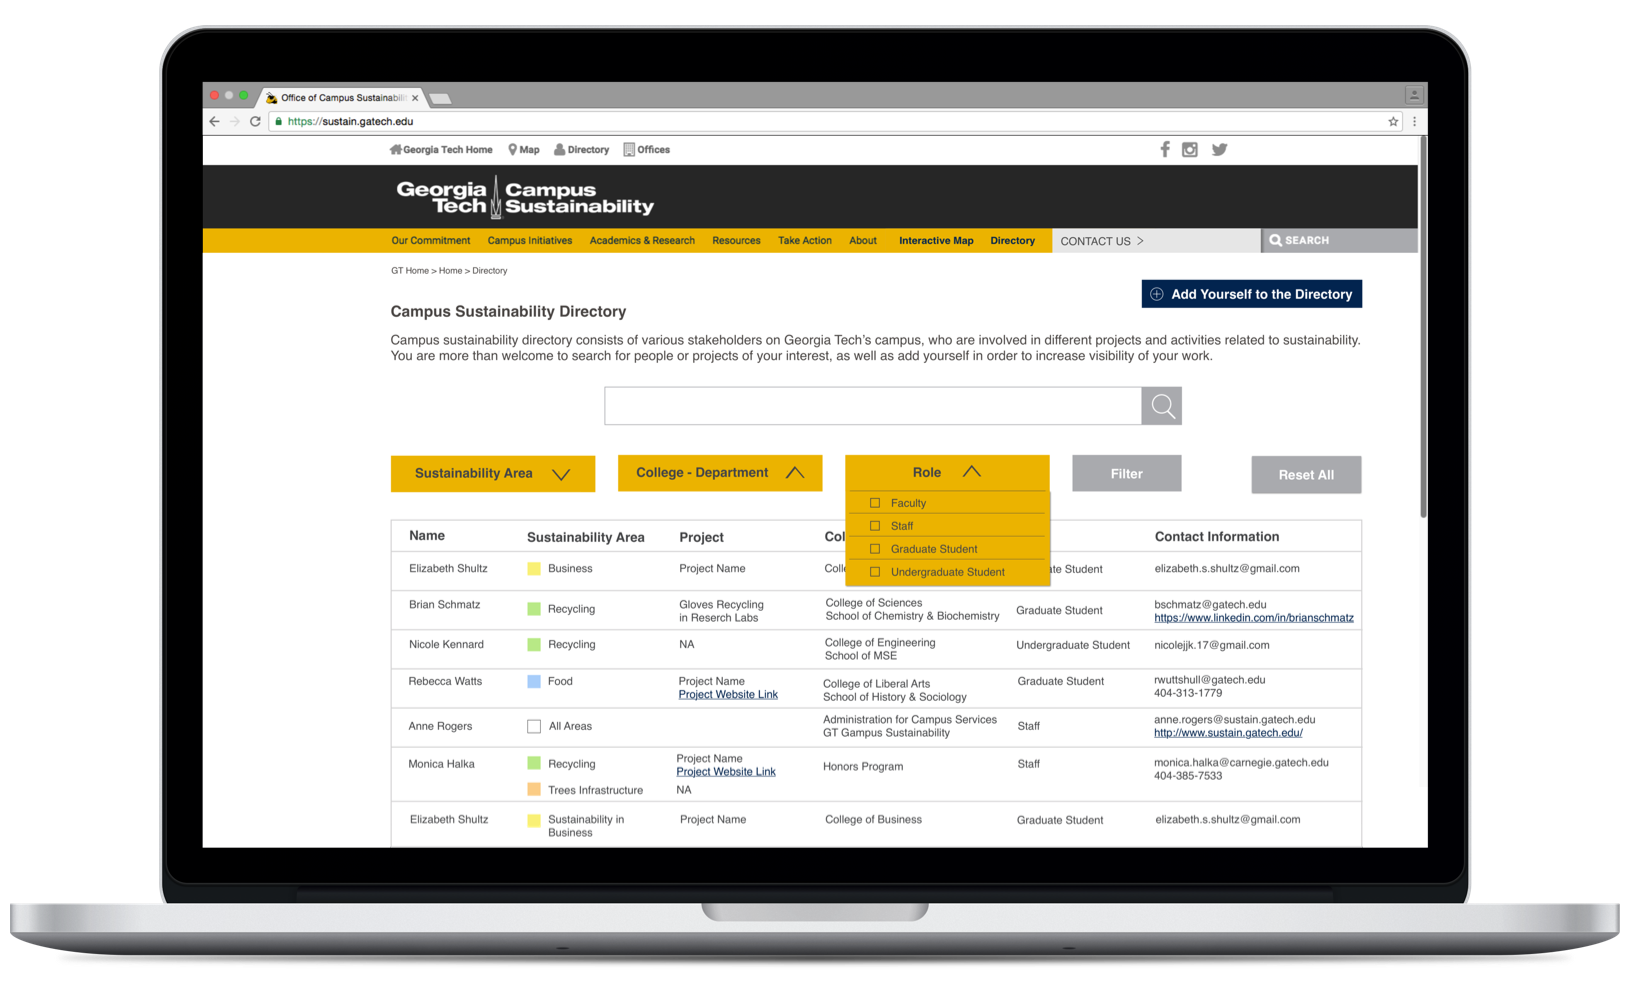
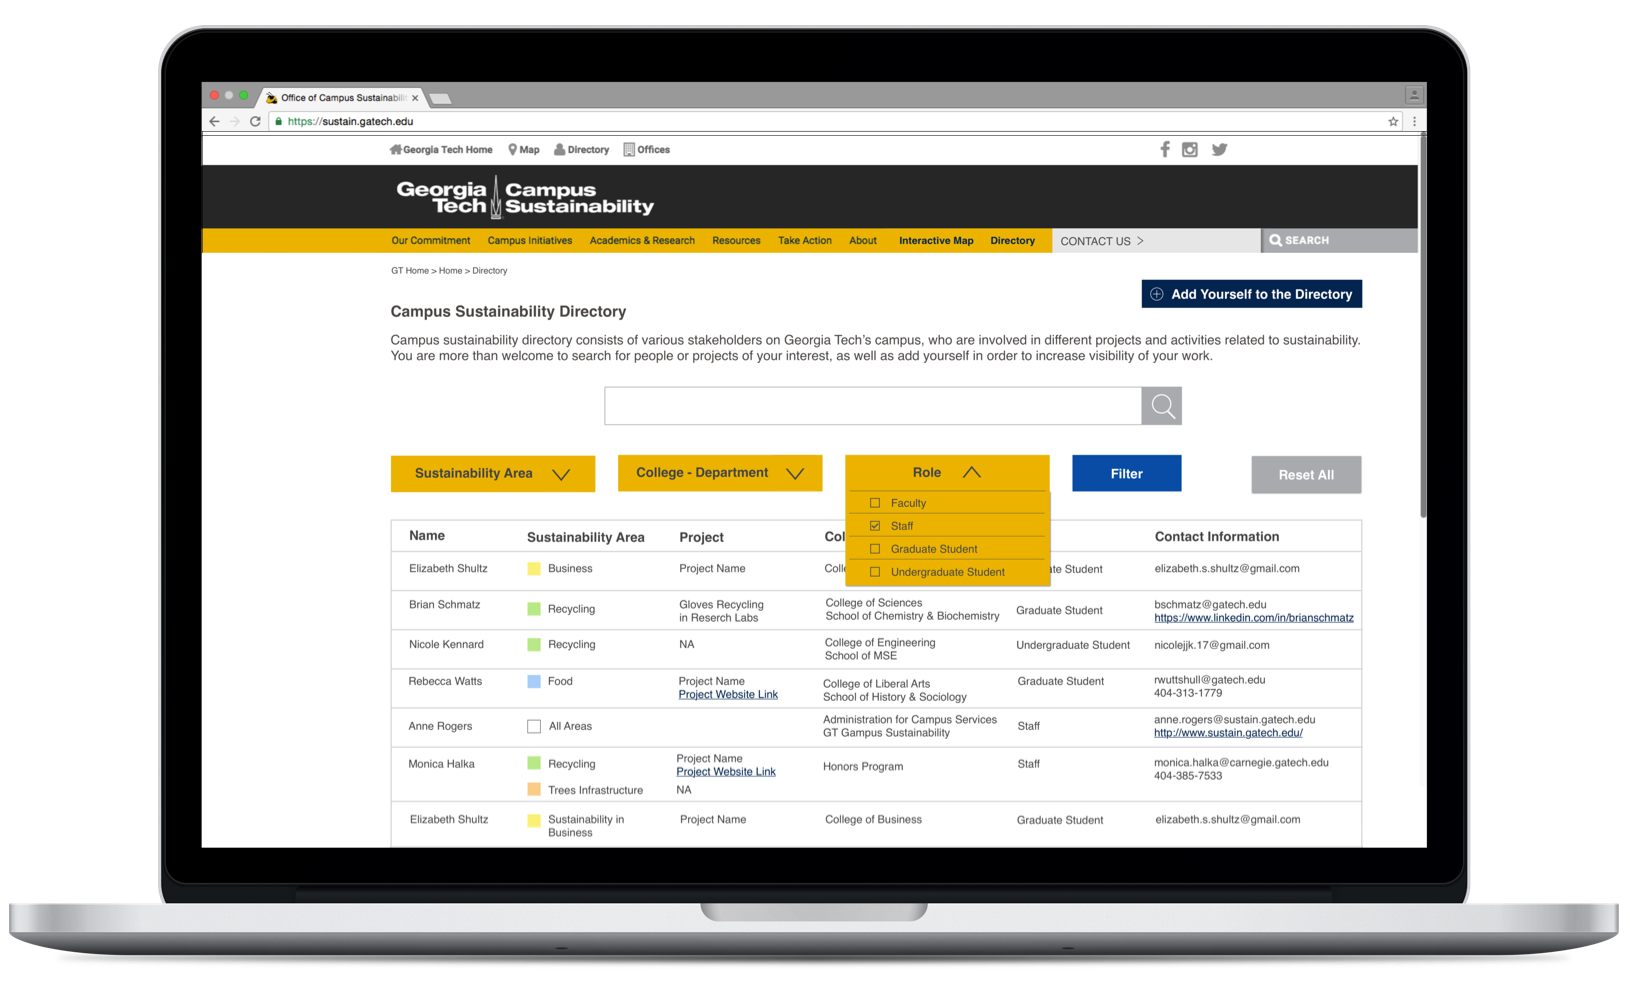
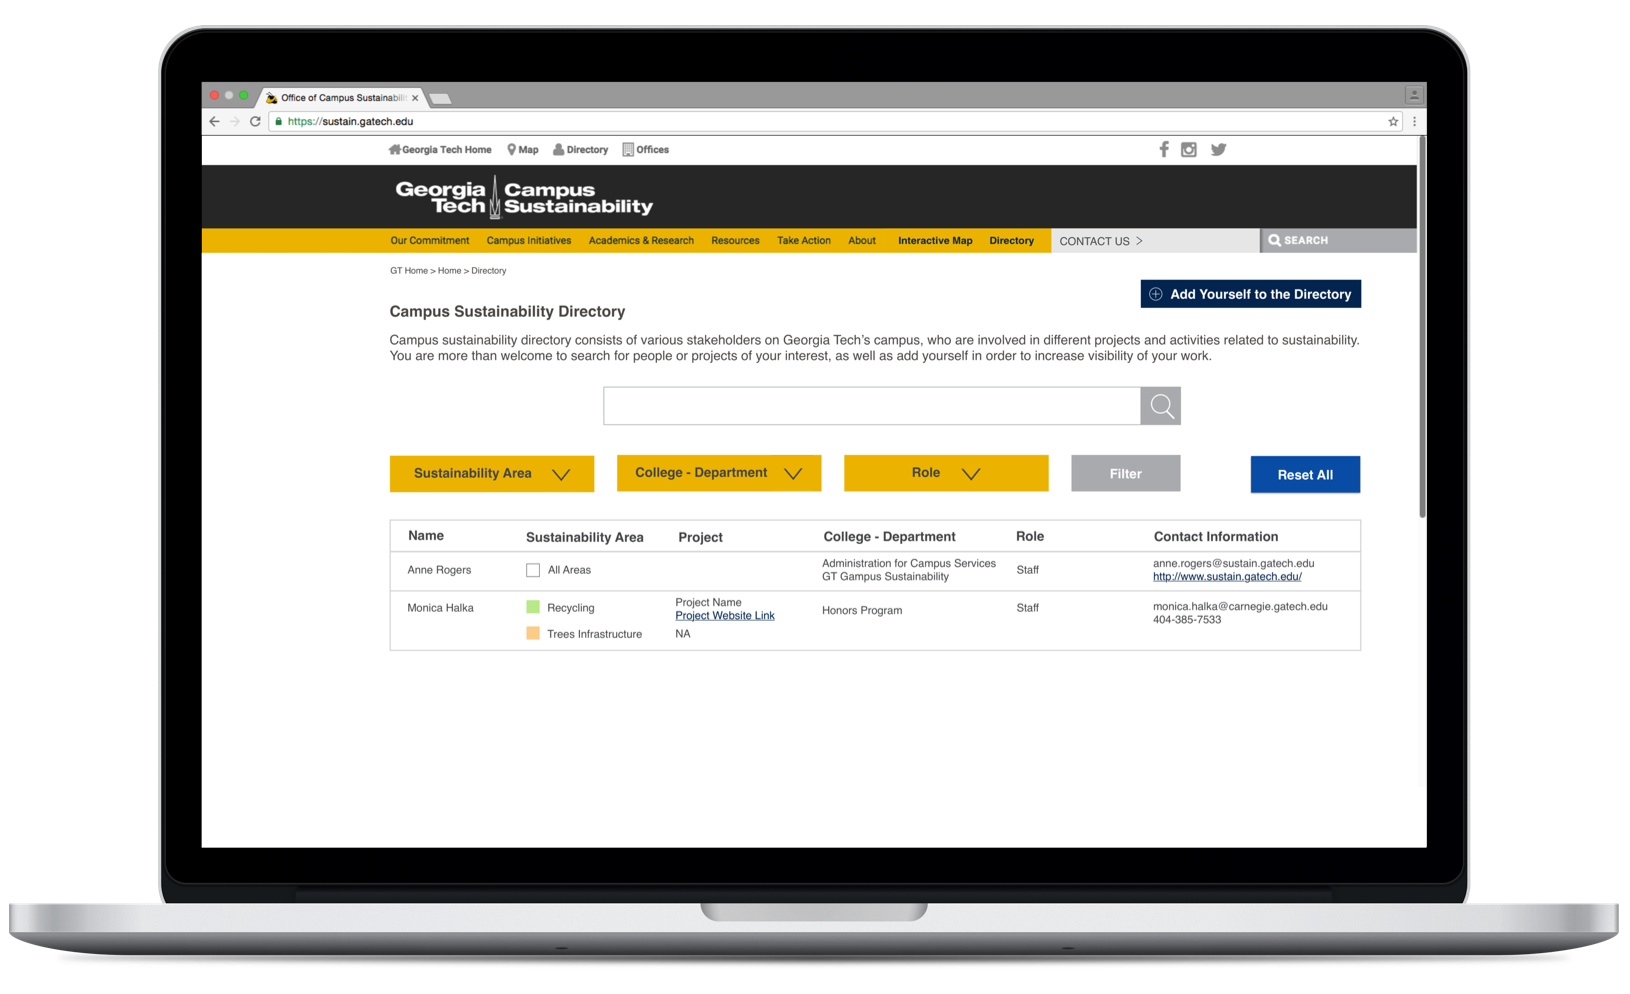
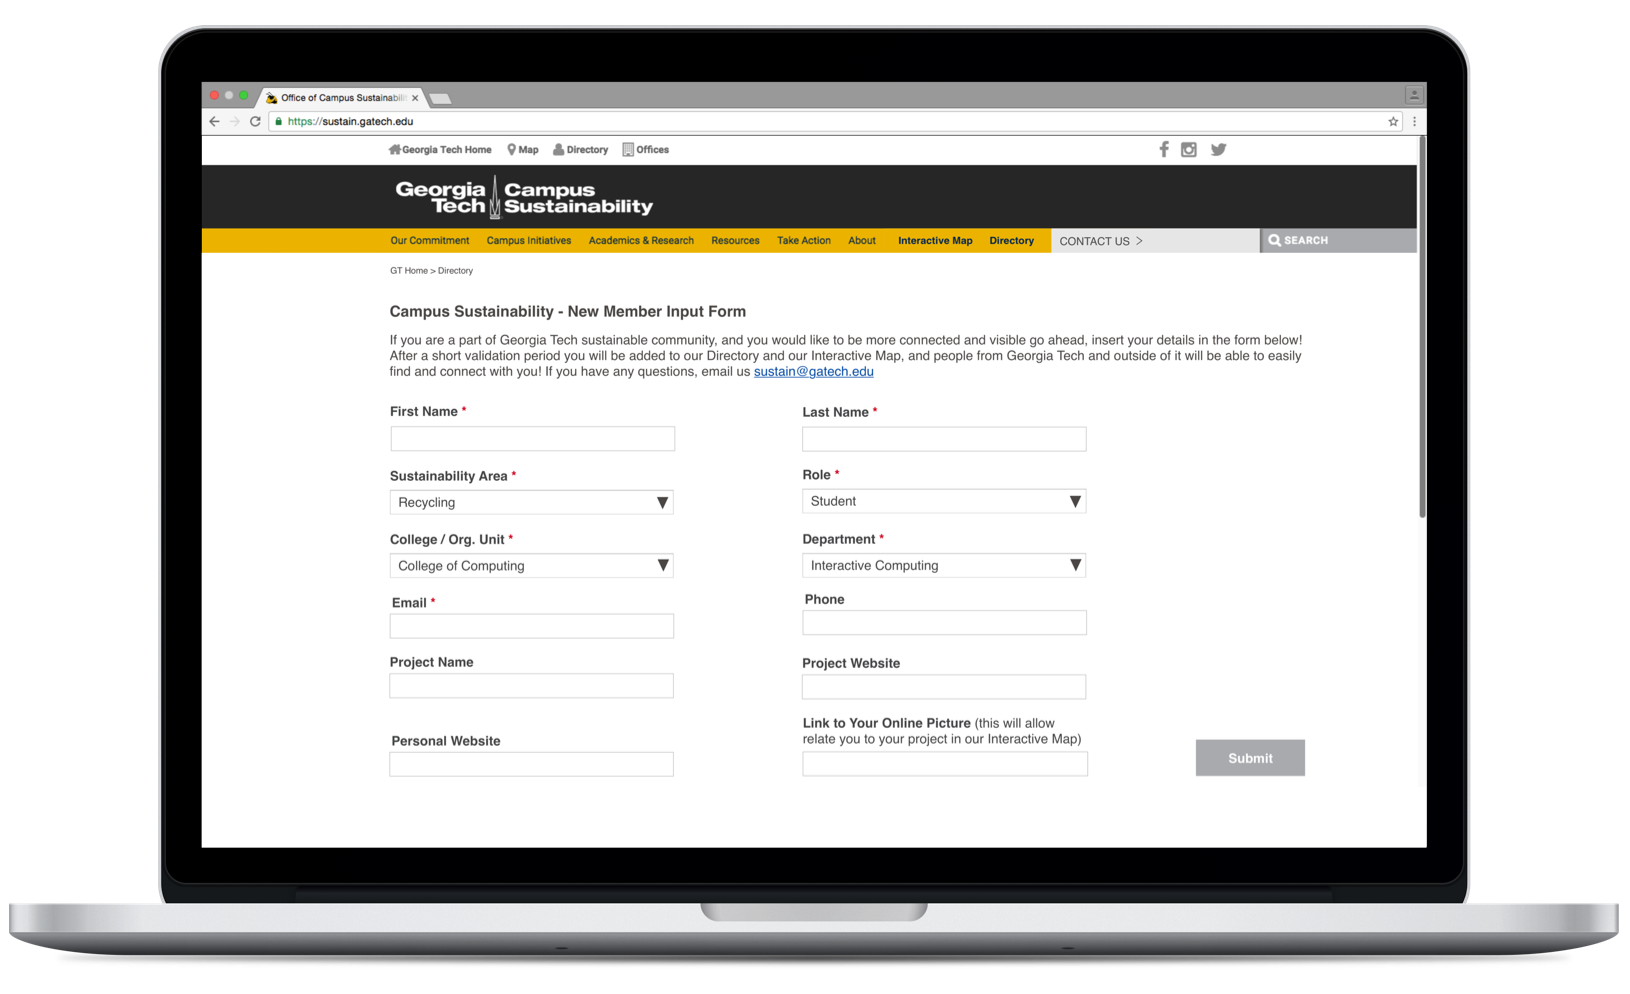
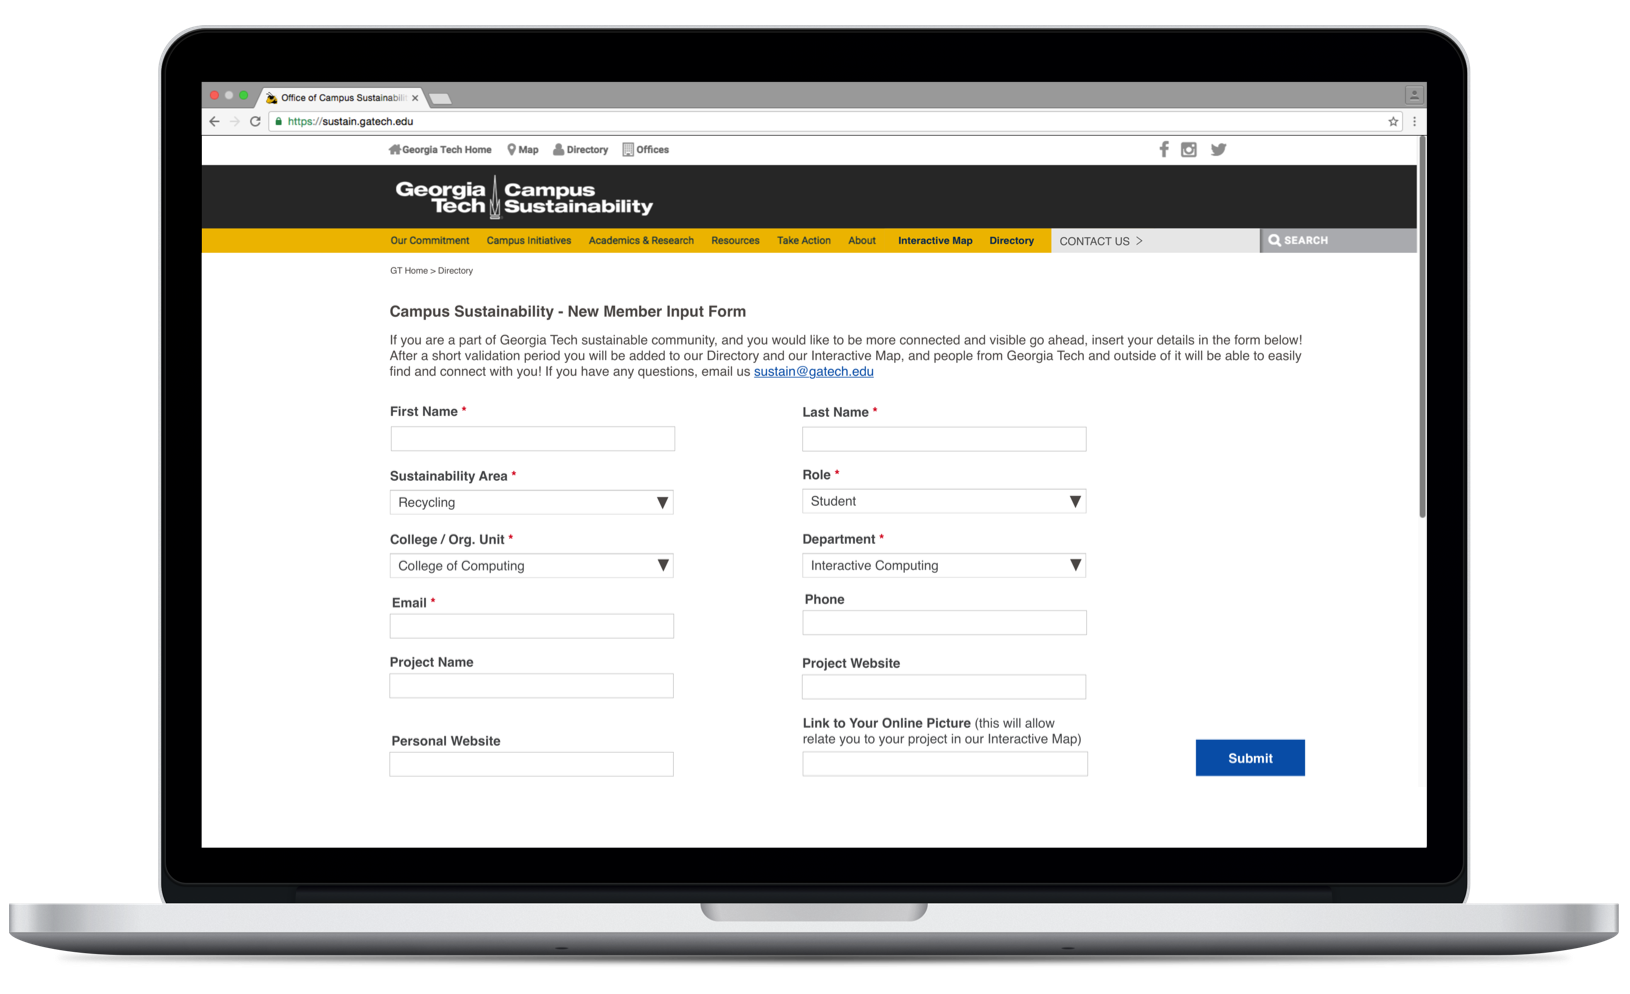
Directory - each record in the directory represents an individual on campus who is involved in a sustainability related project or initiative. Every record consists of person’s name, sustainability related area, project, department, role, and contact information. The editing access to the directory is given only to representatives of the Office of Campus Sustainability at Georgia Tech. However, anyone on campus can filter the directory and/or search though it using a textual search or the main filters (sustainability area, college/department, and role).
Final Result
To ensure that our work can be continued by future generations of students, we created thorough documentation of our project.
What did I Learn?
How to create a comprehensive visualization without overwhelming the user?
When presented with all existing information users can be overwhelmed or distracted. The system should therefore limit the number of visible entities on the screen and show more information about a selected object on user demand. However it’s unadvisable not to show any information in order to achieve better system performance, because this violates the system visibility design principle. The above lesson has had long-lasting impact and helped me to design the Map screen interactions in the RadioTrax web-portal project.How to improve communication between designers and developers?
Usage of static prototypes alone to deliver design specifications to developers is insufficient. Such an approach can lead to misunderstandings and cause unnecessary delays. Therefore, prototypes should be interactive and in addition, verbal communication should take place between designers and developers. If the above is still not sufficient, the designer can record "a walk through an interactive prototype" on video.
Testimonials


“… I have offered this class for nearly 10 years with roughly 10 project teams each year. I can say without question that Felix was one of the most engaged and dedicated students I have had in the course. His commitment to high quality work, his skill and comfort interacting with a client, and his design skills all stand out …” Read more
“… Felix was a great project and client relations manager on a project he facilitated through a course called Computing for Good … Felix excelled at clearly communicating the project problem and working in a dynamic team to develop unique solutions …” Read more